|
Download Data (XLS File) |
|
||||||||
|
||||||||
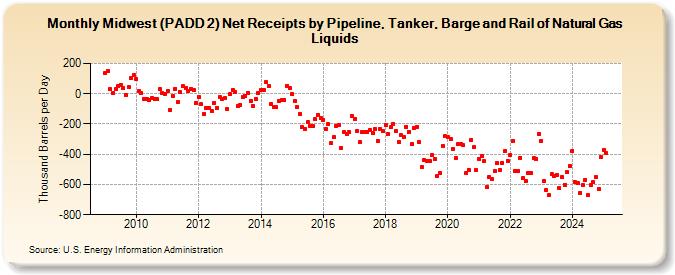
| Midwest (PADD 2) Net Receipts by Pipeline, Tanker, Barge and Rail of Natural Gas Liquids (Thousand Barrels per Day) | ||||||||
| Year | Jan | Feb | Mar | Apr | May | Jun | Jul | Aug | Sep | Oct | Nov | Dec |
|---|---|---|---|---|---|---|---|---|---|---|---|---|
| 2009 | 138 | 150 | 28 | 8 | 31 | 48 | 61 | 37 | -10 | 42 | 103 | 125 |
| 2010 | 98 | 15 | 4 | -32 | -35 | -42 | -26 | -34 | -37 | 28 | 5 | -2 |
| 2011 | 21 | -106 | -16 | 34 | -54 | 9 | 48 | 37 | 19 | 34 | 22 | -61 |
| 2012 | -20 | -70 | -135 | -97 | -94 | -116 | -59 | -94 | -23 | -37 | -30 | -100 |
| 2013 | -4 | 26 | 12 | -81 | -72 | -23 | -14 | 8 | -47 | -80 | -32 | 2 |
| 2014 | 25 | 27 | 75 | 48 | -69 | -85 | -88 | -47 | -39 | -43 | 54 | 41 |
| 2015 | -4 | -49 | -89 | -135 | -223 | -231 | -189 | -215 | -216 | -169 | -142 | -162 |
| 2016 | -174 | -230 | -203 | -328 | -288 | -213 | -209 | -356 | -254 | -263 | -254 | -145 |
| 2017 | -164 | -244 | -321 | -256 | -256 | -254 | -239 | -259 | -234 | -312 | -232 | -248 |
| 2018 | -205 | -266 | -222 | -200 | -246 | -316 | -276 | -287 | -218 | -251 | -334 | -225 |
| 2019 | -218 | -321 | -486 | -437 | -446 | -445 | -406 | -431 | -543 | -521 | -345 | -281 |
| 2020 | -288 | -299 | -365 | -423 | -335 | -333 | -342 | -525 | -502 | -305 | -354 | -507 |
| 2021 | -431 | -415 | -448 | -619 | -550 | -564 | -512 | -459 | -502 | -456 | -381 | -442 |
| 2022 | -403 | -314 | -510 | -510 | -423 | -559 | -578 | -525 | -524 | -427 | -433 | -264 |
| 2023 | -312 | -579 | -574 | -646 | -533 | -544 | -535 | -624 | -552 | -601 | -517 | -445 |
| 2024 | -359 | |||||||||||
| - = No Data Reported; -- = Not Applicable; NA = Not Available; W = Withheld to avoid disclosure of individual company data. |
| Release Date: 3/29/2024 |
| Next Release Date: 4/30/2024 |