|
Download Data (XLS File) |
|
||||||||
|
||||||||
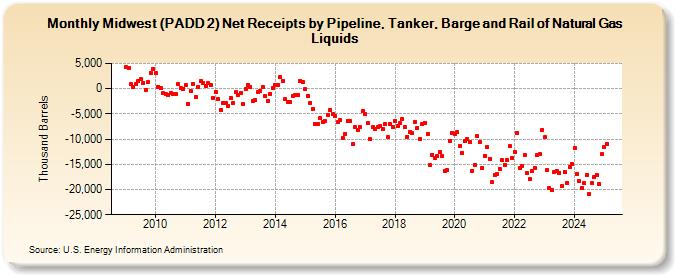
| Midwest (PADD 2) Net Receipts by Pipeline, Tanker, Barge and Rail of Natural Gas Liquids (Thousand Barrels) | ||||||||
| Year | Jan | Feb | Mar | Apr | May | Jun | Jul | Aug | Sep | Oct | Nov | Dec |
|---|---|---|---|---|---|---|---|---|---|---|---|---|
| 2009 | 4,265 | 4,186 | 859 | 251 | 955 | 1,438 | 1,905 | 1,139 | -291 | 1,294 | 3,098 | 3,867 |
| 2010 | 3,023 | 427 | 111 | -946 | -1,089 | -1,269 | -794 | -1,053 | -1,118 | 877 | 162 | -53 |
| 2011 | 659 | -2,957 | -485 | 1,019 | -1,662 | 269 | 1,499 | 1,159 | 581 | 1,066 | 652 | -1,888 |
| 2012 | -625 | -2,036 | -4,183 | -2,905 | -2,906 | -3,474 | -1,817 | -2,913 | -680 | -1,161 | -885 | -3,099 |
| 2013 | -111 | 735 | 363 | -2,432 | -2,233 | -697 | -424 | 260 | -1,403 | -2,469 | -967 | 65 |
| 2014 | 779 | 761 | 2,337 | 1,439 | -2,136 | -2,556 | -2,740 | -1,461 | -1,171 | -1,318 | 1,618 | 1,261 |
| 2015 | -121 | -1,377 | -2,763 | -4,051 | -6,926 | -6,923 | -5,868 | -6,650 | -6,471 | -5,240 | -4,252 | -5,015 |
| 2016 | -5,405 | -6,663 | -6,297 | -9,830 | -8,934 | -6,388 | -6,470 | -11,044 | -7,611 | -8,161 | -7,634 | -4,506 |
| 2017 | -5,077 | -6,831 | -9,955 | -7,694 | -7,930 | -7,624 | -7,416 | -8,038 | -7,013 | -9,662 | -6,966 | -7,673 |
| 2018 | -6,354 | -7,447 | -6,881 | -6,013 | -7,613 | -9,487 | -8,558 | -8,882 | -6,547 | -7,791 | -10,021 | -6,967 |
| 2019 | -6,758 | -9,000 | -15,063 | -13,118 | -13,819 | -13,348 | -12,575 | -13,357 | -16,294 | -16,160 | -10,361 | -8,697 |
| 2020 | -8,927 | -8,682 | -11,326 | -12,700 | -10,377 | -9,976 | -10,616 | -16,271 | -15,068 | -9,453 | -10,634 | -15,714 |
| 2021 | -13,358 | -11,624 | -13,893 | -18,577 | -17,038 | -16,927 | -15,865 | -14,235 | -15,070 | -14,150 | -11,443 | -13,688 |
| 2022 | -12,494 | -8,803 | -15,809 | -15,286 | -13,123 | -16,764 | -17,918 | -16,285 | -15,734 | -13,241 | -12,999 | -8,177 |
| 2023 | -9,659 | -16,225 | -17,798 | -19,370 | -16,522 | -16,313 | -16,578 | -19,342 | -16,563 | -18,627 | -15,508 | -13,798 |
| 2024 | -11,134 | |||||||||||
| - = No Data Reported; -- = Not Applicable; NA = Not Available; W = Withheld to avoid disclosure of individual company data. |
| Release Date: 3/29/2024 |
| Next Release Date: 4/30/2024 |