|
Download Data (XLS File) |
|
||||||||
|
||||||||
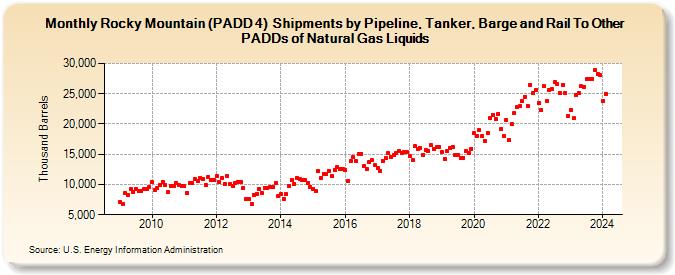
| Rocky Mountain (PADD 4) Shipments by Pipeline, Tanker, Barge and Rail To Other PADDs of Natural Gas Liquids (Thousand Barrels) | ||||||||
| Year | Jan | Feb | Mar | Apr | May | Jun | Jul | Aug | Sep | Oct | Nov | Dec |
|---|---|---|---|---|---|---|---|---|---|---|---|---|
| 2009 | 7,105 | 6,818 | 8,538 | 8,211 | 9,207 | 8,739 | 9,278 | 8,968 | 8,940 | 9,192 | 9,289 | 9,543 |
| 2010 | 10,343 | 9,070 | 9,413 | 9,970 | 10,478 | 9,914 | 8,751 | 9,821 | 9,692 | 10,251 | 9,851 | 9,789 |
| 2011 | 9,730 | 8,611 | 10,183 | 10,187 | 10,849 | 10,561 | 11,039 | 10,921 | 9,908 | 11,196 | 10,815 | 10,676 |
| 2012 | 11,385 | 10,374 | 11,065 | 10,132 | 11,361 | 10,068 | 9,794 | 10,250 | 10,490 | 10,426 | 9,491 | 7,544 |
| 2013 | 7,542 | 6,833 | 8,332 | 8,476 | 9,303 | 8,595 | 9,489 | 9,468 | 9,615 | 9,569 | 10,270 | 8,055 |
| 2014 | 8,367 | 7,680 | 8,349 | 9,798 | 10,738 | 10,122 | 11,147 | 10,934 | 10,726 | 10,720 | 10,267 | 9,586 |
| 2015 | 9,324 | 8,895 | 12,202 | 11,089 | 11,798 | 11,762 | 12,278 | 11,437 | 12,445 | 12,912 | 12,512 | 12,541 |
| 2016 | 12,410 | 10,593 | 13,873 | 14,488 | 13,837 | 15,099 | 15,106 | 12,983 | 12,491 | 13,674 | 13,981 | 13,198 |
| 2017 | 12,666 | 12,227 | 13,952 | 14,367 | 15,143 | 14,600 | 14,920 | 15,197 | 15,503 | 15,254 | 15,383 | 15,330 |
| 2018 | 14,625 | 14,018 | 16,280 | 15,871 | 16,086 | 14,923 | 15,767 | 15,605 | 16,520 | 15,897 | 16,132 | 16,223 |
| 2019 | 15,412 | 14,256 | 15,547 | 16,062 | 16,257 | 14,805 | 14,917 | 14,393 | 14,412 | 15,492 | 15,188 | 15,906 |
| 2020 | 18,429 | 18,085 | 19,023 | 17,943 | 17,228 | 18,520 | 20,948 | 21,539 | 20,803 | 21,730 | 19,147 | 17,978 |
| 2021 | 20,696 | 17,326 | 19,987 | 21,743 | 22,799 | 22,950 | 23,773 | 24,528 | 22,969 | 26,507 | 25,153 | 25,685 |
| 2022 | 23,533 | 22,304 | 26,264 | 23,726 | 25,565 | 25,748 | 26,969 | 26,578 | 25,121 | 26,490 | 25,075 | 21,382 |
| 2023 | 22,383 | 20,916 | 24,743 | 25,048 | 26,232 | 26,159 | 27,384 | 27,383 | 27,490 | 28,846 | 28,301 | 28,018 |
| 2024 | 23,865 | |||||||||||
| - = No Data Reported; -- = Not Applicable; NA = Not Available; W = Withheld to avoid disclosure of individual company data. |
| Release Date: 3/29/2024 |
| Next Release Date: 4/30/2024 |
Referring Pages: