|
Download Data (XLS File) |
|
||||||||
|
||||||||
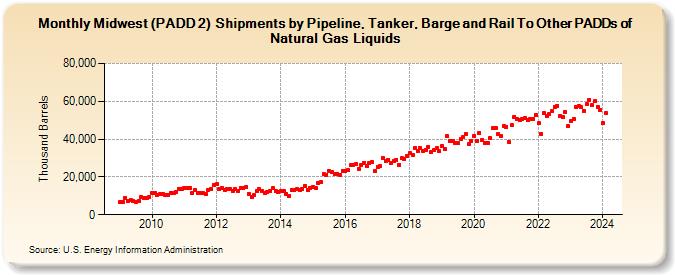
| Midwest (PADD 2) Shipments by Pipeline, Tanker, Barge and Rail To Other PADDs of Natural Gas Liquids (Thousand Barrels) | ||||||||
| Year | Jan | Feb | Mar | Apr | May | Jun | Jul | Aug | Sep | Oct | Nov | Dec |
|---|---|---|---|---|---|---|---|---|---|---|---|---|
| 2009 | 6,640 | 6,888 | 8,847 | 7,257 | 7,749 | 7,212 | 6,903 | 7,494 | 9,273 | 8,790 | 8,829 | 9,186 |
| 2010 | 11,597 | 11,392 | 10,585 | 11,072 | 10,977 | 10,556 | 10,169 | 11,637 | 11,306 | 12,178 | 13,611 | 13,366 |
| 2011 | 14,004 | 14,292 | 13,908 | 11,628 | 13,300 | 11,557 | 11,381 | 11,263 | 10,975 | 13,098 | 13,846 | 15,809 |
| 2012 | 16,009 | 13,494 | 14,044 | 13,284 | 13,733 | 13,611 | 12,753 | 13,444 | 12,463 | 14,093 | 13,942 | 14,807 |
| 2013 | 11,143 | 9,352 | 10,417 | 12,590 | 13,348 | 12,428 | 11,445 | 12,274 | 12,794 | 13,913 | 12,730 | 11,958 |
| 2014 | 12,340 | 12,337 | 11,131 | 9,837 | 13,164 | 13,100 | 13,617 | 12,933 | 13,536 | 15,155 | 13,119 | 14,078 |
| 2015 | 14,790 | 14,116 | 16,564 | 17,288 | 21,278 | 21,216 | 23,251 | 22,443 | 21,788 | 21,573 | 20,808 | 23,237 |
| 2016 | 23,108 | 23,434 | 26,136 | 26,412 | 26,921 | 24,233 | 26,493 | 27,609 | 25,831 | 27,532 | 27,737 | 23,054 |
| 2017 | 25,230 | 25,514 | 30,210 | 28,159 | 29,183 | 27,399 | 28,502 | 29,167 | 26,432 | 29,859 | 29,331 | 31,024 |
| 2018 | 32,570 | 31,366 | 35,437 | 33,729 | 35,228 | 33,890 | 34,278 | 36,050 | 33,347 | 34,075 | 35,186 | 33,467 |
| 2019 | 36,149 | 34,817 | 41,411 | 39,169 | 38,989 | 38,087 | 37,755 | 39,992 | 41,177 | 42,765 | 37,177 | 38,975 |
| 2020 | 41,771 | 39,176 | 43,283 | 39,568 | 37,915 | 38,197 | 40,475 | 45,925 | 45,805 | 42,661 | 41,531 | 46,782 |
| 2021 | 46,418 | 38,246 | 47,251 | 51,826 | 50,369 | 50,149 | 50,693 | 50,922 | 49,885 | 50,725 | 50,859 | 52,803 |
| 2022 | 48,252 | 42,924 | 54,009 | 52,061 | 53,121 | 54,721 | 57,182 | 57,744 | 52,387 | 51,592 | 54,357 | 46,726 |
| 2023 | 49,350 | 50,690 | 57,204 | 57,584 | 56,730 | 55,014 | 58,536 | 60,927 | 58,073 | 59,927 | 57,230 | 55,605 |
| 2024 | 48,467 | |||||||||||
| - = No Data Reported; -- = Not Applicable; NA = Not Available; W = Withheld to avoid disclosure of individual company data. |
| Release Date: 3/29/2024 |
| Next Release Date: 4/30/2024 |