|
Download Data (XLS File) |
|
||||||||
|
||||||||
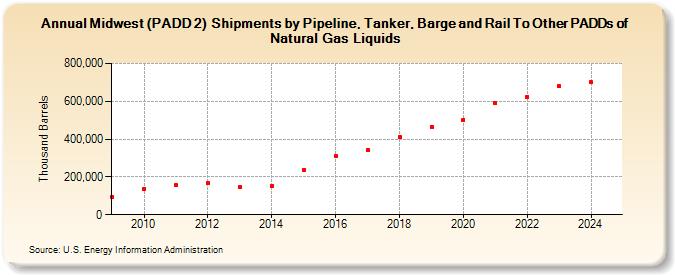
| Midwest (PADD 2) Shipments by Pipeline, Tanker, Barge and Rail To Other PADDs of Natural Gas Liquids (Thousand Barrels) | ||||||||
| Decade | Year-0 | Year-1 | Year-2 | Year-3 | Year-4 | Year-5 | Year-6 | Year-7 | Year-8 | Year-9 |
|---|---|---|---|---|---|---|---|---|---|---|
| 2000's | 95,068 | |||||||||
| 2010's | 138,446 | 155,061 | 165,677 | 144,392 | 154,347 | 238,352 | 308,500 | 340,010 | 408,623 | 466,463 |
| 2020's | 503,089 | 590,146 | 625,075 | 680,823 | 700,215 |
| - = No Data Reported; -- = Not Applicable; NA = Not Available; W = Withheld to avoid disclosure of individual company data. |
| Release Date: 6/30/2025 |
| Next Release Date: 8/29/2025 |