|
Download Data (XLS File) |
|
||||||||
|
||||||||
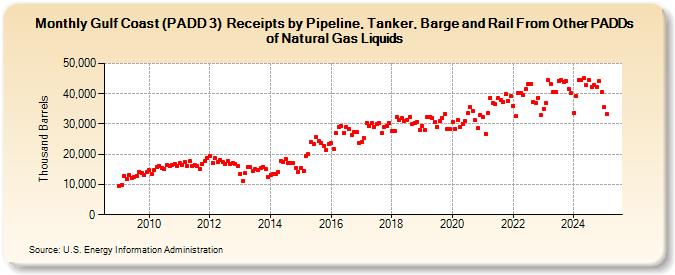
| Gulf Coast (PADD 3) Receipts by Pipeline, Tanker, Barge and Rail From Other PADDs of Natural Gas Liquids (Thousand Barrels) | ||||||||
| Year | Jan | Feb | Mar | Apr | May | Jun | Jul | Aug | Sep | Oct | Nov | Dec |
|---|---|---|---|---|---|---|---|---|---|---|---|---|
| 2009 | 9,330 | 9,767 | 12,944 | 11,790 | 13,188 | 12,054 | 12,473 | 12,882 | 14,231 | 13,709 | 13,239 | 14,016 |
| 2010 | 14,660 | 13,400 | 14,752 | 15,679 | 16,178 | 15,608 | 15,272 | 16,421 | 16,165 | 16,338 | 16,919 | 16,054 |
| 2011 | 16,981 | 16,451 | 17,392 | 16,158 | 17,619 | 16,247 | 16,562 | 16,012 | 15,268 | 16,865 | 17,638 | 18,904 |
| 2012 | 19,547 | 17,196 | 18,589 | 17,419 | 18,152 | 17,340 | 16,915 | 17,820 | 16,698 | 17,106 | 16,645 | 16,146 |
| 2013 | 13,623 | 11,139 | 13,636 | 15,621 | 15,689 | 14,378 | 14,993 | 14,708 | 15,293 | 15,679 | 15,077 | 12,520 |
| 2014 | 13,268 | 13,339 | 13,427 | 14,193 | 17,866 | 17,515 | 18,567 | 17,220 | 16,992 | 17,085 | 15,559 | 14,199 |
| 2015 | 15,402 | 14,383 | 19,299 | 19,939 | 24,100 | 23,315 | 25,631 | 24,226 | 23,565 | 22,744 | 21,446 | 23,371 |
| 2016 | 23,552 | 21,565 | 26,853 | 29,144 | 29,312 | 27,085 | 29,096 | 28,176 | 26,419 | 27,470 | 27,225 | 23,722 |
| 2017 | 24,190 | 25,224 | 30,333 | 29,217 | 30,402 | 29,017 | 29,969 | 30,394 | 27,044 | 29,019 | 29,392 | 30,352 |
| 2018 | 27,831 | 27,674 | 32,262 | 31,298 | 32,127 | 30,957 | 31,308 | 32,236 | 29,935 | 30,457 | 30,786 | 28,117 |
| 2019 | 29,291 | 27,897 | 32,269 | 32,465 | 32,034 | 30,504 | 29,150 | 30,936 | 32,031 | 33,378 | 28,465 | 28,209 |
| 2020 | 30,730 | 28,493 | 31,467 | 29,116 | 30,135 | 30,880 | 33,510 | 35,475 | 34,315 | 31,266 | 28,621 | 33,019 |
| 2021 | 32,276 | 26,815 | 33,498 | 38,678 | 36,817 | 36,520 | 38,454 | 37,925 | 37,332 | 39,856 | 37,697 | 39,087 |
| 2022 | 36,031 | 32,676 | 40,287 | 40,104 | 39,416 | 41,515 | 43,276 | 43,311 | 37,415 | 37,041 | 38,600 | 33,010 |
| 2023 | 34,870 | 36,819 | 44,431 | 43,174 | 40,649 | 40,557 | 44,297 | 44,627 | 43,787 | 44,269 | 41,572 | 39,980 |
| 2024 | 33,584 | |||||||||||
| - = No Data Reported; -- = Not Applicable; NA = Not Available; W = Withheld to avoid disclosure of individual company data. |
| Release Date: 3/29/2024 |
| Next Release Date: 4/30/2024 |