|
Download Data (XLS File) |
|
||||||||
|
||||||||
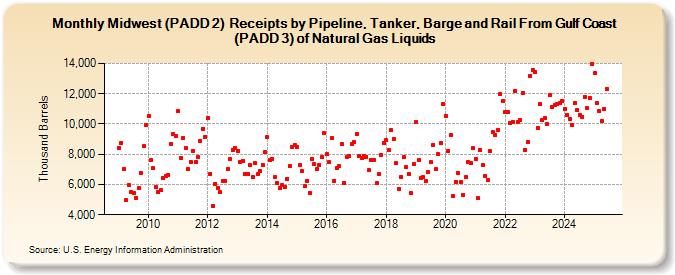
| Midwest (PADD 2) Receipts by Pipeline, Tanker, Barge and Rail From Gulf Coast (PADD 3) of Natural Gas Liquids (Thousand Barrels) | ||||||||
| Year | Jan | Feb | Mar | Apr | May | Jun | Jul | Aug | Sep | Oct | Nov | Dec |
|---|---|---|---|---|---|---|---|---|---|---|---|---|
| 2009 | 8,396 | 8,771 | 7,007 | 4,970 | 5,997 | 5,491 | 5,452 | 5,129 | 5,750 | 6,770 | 8,528 | 9,922 |
| 2010 | 10,558 | 7,596 | 7,056 | 5,864 | 5,473 | 5,628 | 6,459 | 6,569 | 6,635 | 8,695 | 9,325 | 9,184 |
| 2011 | 10,826 | 7,739 | 9,082 | 8,415 | 7,031 | 7,486 | 8,240 | 7,489 | 7,816 | 8,905 | 9,686 | 9,157 |
| 2012 | 10,378 | 6,700 | 4,594 | 6,049 | 5,757 | 5,470 | 6,254 | 6,247 | 6,995 | 7,677 | 8,289 | 8,434 |
| 2013 | 8,223 | 7,517 | 7,540 | 6,667 | 6,689 | 7,263 | 6,483 | 7,413 | 6,661 | 6,902 | 7,301 | 8,121 |
| 2014 | 9,108 | 7,643 | 7,701 | 6,475 | 6,102 | 5,779 | 5,948 | 5,843 | 6,386 | 7,220 | 8,491 | 8,638 |
| 2015 | 8,459 | 7,265 | 6,898 | 5,875 | 6,250 | 5,445 | 7,708 | 7,351 | 7,049 | 7,304 | 7,786 | 9,398 |
| 2016 | 7,995 | 7,456 | 9,089 | 6,244 | 7,105 | 7,200 | 8,645 | 6,108 | 7,819 | 7,866 | 8,654 | 8,799 |
| 2017 | 9,339 | 7,879 | 7,766 | 7,885 | 7,846 | 6,936 | 7,617 | 7,619 | 6,079 | 6,672 | 7,958 | 8,743 |
| 2018 | 8,916 | 8,271 | 9,585 | 9,038 | 7,404 | 5,705 | 6,500 | 7,792 | 7,151 | 6,707 | 5,424 | 7,338 |
| 2019 | 10,145 | 7,588 | 6,412 | 6,484 | 6,229 | 6,817 | 7,456 | 8,620 | 6,999 | 7,996 | 8,718 | 11,352 |
| 2020 | 10,547 | 8,214 | 9,296 | 5,222 | 6,191 | 6,758 | 6,157 | 5,331 | 6,461 | 7,475 | 7,439 | 8,392 |
| 2021 | 7,708 | 5,100 | 8,263 | 7,257 | 6,564 | 6,282 | 8,190 | 9,457 | 9,292 | 9,628 | 11,981 | 11,502 |
| 2022 | 10,792 | 10,794 | 10,073 | 10,132 | 12,209 | 10,137 | 10,251 | 12,057 | 8,273 | 8,818 | 13,186 | 13,597 |
| 2023 | 13,463 | 9,753 | 11,290 | 10,249 | 10,363 | 9,988 | 11,899 | 11,099 | 11,237 | 11,325 | 11,359 | 11,529 |
| 2024 | 10,952 | |||||||||||
| - = No Data Reported; -- = Not Applicable; NA = Not Available; W = Withheld to avoid disclosure of individual company data. |
| Release Date: 3/29/2024 |
| Next Release Date: 4/30/2024 |