|
Download Data (XLS File) |
|
||||||||
|
||||||||
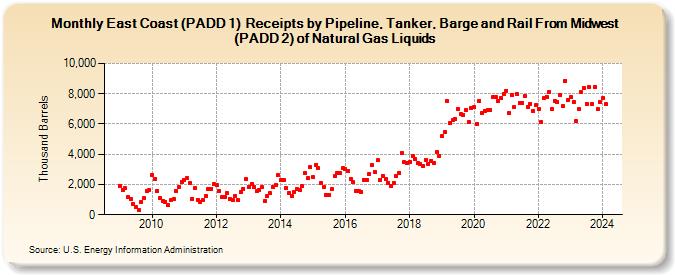
| East Coast (PADD 1) Receipts by Pipeline, Tanker, Barge and Rail From Midwest (PADD 2) of Natural Gas Liquids (Thousand Barrels) | ||||||||
| Year | Jan | Feb | Mar | Apr | May | Jun | Jul | Aug | Sep | Oct | Nov | Dec |
|---|---|---|---|---|---|---|---|---|---|---|---|---|
| 2009 | 1,906 | 1,636 | 1,742 | 1,140 | 1,061 | 738 | 490 | 284 | 859 | 1,096 | 1,564 | 1,662 |
| 2010 | 2,654 | 2,383 | 1,597 | 1,094 | 925 | 865 | 637 | 950 | 1,038 | 1,572 | 1,848 | 2,179 |
| 2011 | 2,323 | 2,406 | 2,099 | 1,062 | 1,758 | 991 | 866 | 970 | 1,251 | 1,702 | 1,724 | 2,008 |
| 2012 | 1,961 | 1,581 | 1,147 | 1,184 | 1,431 | 1,014 | 978 | 1,239 | 956 | 1,503 | 1,729 | 2,354 |
| 2013 | 1,850 | 2,039 | 1,826 | 1,552 | 1,636 | 1,803 | 875 | 1,259 | 1,415 | 1,817 | 1,951 | 2,600 |
| 2014 | 2,272 | 2,311 | 1,760 | 1,449 | 1,268 | 1,531 | 1,687 | 1,643 | 1,898 | 2,751 | 2,404 | 3,130 |
| 2015 | 2,492 | 3,312 | 3,074 | 2,068 | 1,843 | 1,307 | 1,323 | 1,695 | 2,549 | 2,742 | 2,743 | 3,071 |
| 2016 | 3,030 | 2,874 | 2,376 | 2,140 | 1,591 | 1,561 | 1,505 | 2,324 | 2,321 | 2,723 | 3,255 | 2,838 |
| 2017 | 3,596 | 2,319 | 2,586 | 2,342 | 2,118 | 1,873 | 2,084 | 2,572 | 2,785 | 4,070 | 3,470 | 3,389 |
| 2018 | 3,514 | 3,905 | 3,707 | 3,396 | 3,385 | 3,225 | 3,622 | 3,368 | 3,582 | 3,450 | 4,138 | 3,884 |
| 2019 | 5,178 | 5,482 | 7,488 | 6,039 | 6,235 | 6,319 | 6,975 | 6,634 | 6,620 | 6,921 | 6,108 | 7,055 |
| 2020 | 7,114 | 6,029 | 7,551 | 6,723 | 6,858 | 6,925 | 6,901 | 7,780 | 7,761 | 7,507 | 7,719 | 7,991 |
| 2021 | 8,213 | 6,729 | 7,887 | 7,091 | 7,972 | 7,413 | 7,396 | 7,824 | 7,149 | 7,327 | 6,883 | 7,230 |
| 2022 | 7,009 | 6,117 | 7,703 | 7,811 | 8,133 | 7,023 | 7,541 | 7,453 | 7,889 | 7,164 | 8,864 | 7,580 |
| 2023 | 7,752 | 7,480 | 6,203 | 6,974 | 8,112 | 8,391 | 7,344 | 8,430 | 7,329 | 8,451 | 6,964 | 7,441 |
| 2024 | 7,710 | |||||||||||
| - = No Data Reported; -- = Not Applicable; NA = Not Available; W = Withheld to avoid disclosure of individual company data. |
| Release Date: 3/29/2024 |
| Next Release Date: 4/30/2024 |