|
Download Data (XLS File) |
|
||||||||
|
||||||||
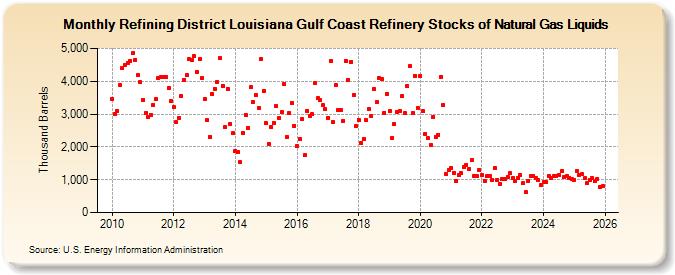
| Refining District Louisiana Gulf Coast Refinery Stocks of Natural Gas Liquids (Thousand Barrels) | ||||||||
| Year | Jan | Feb | Mar | Apr | May | Jun | Jul | Aug | Sep | Oct | Nov | Dec |
|---|---|---|---|---|---|---|---|---|---|---|---|---|
| 2010 | 3,465 | 3,010 | 3,094 | 3,896 | 4,407 | 4,496 | 4,570 | 4,630 | 4,850 | 4,659 | 4,185 | 3,962 |
| 2011 | 3,440 | 3,027 | 2,900 | 2,980 | 3,277 | 3,445 | 4,085 | 4,126 | 4,133 | 4,118 | 3,801 | 3,400 |
| 2012 | 3,202 | 2,756 | 2,892 | 3,552 | 4,051 | 4,179 | 4,670 | 4,640 | 4,756 | 4,284 | 4,662 | 4,111 |
| 2013 | 3,464 | 2,812 | 2,314 | 3,623 | 3,773 | 3,971 | 4,694 | 3,863 | 2,610 | 3,777 | 2,696 | 2,409 |
| 2014 | 1,873 | 1,830 | 1,530 | 2,417 | 2,970 | 2,584 | 3,814 | 3,355 | 3,575 | 3,190 | 4,681 | 3,711 |
| 2015 | 2,719 | 2,100 | 2,612 | 2,720 | 3,236 | 2,879 | 3,051 | 3,916 | 2,306 | 3,027 | 3,335 | 2,645 |
| 2016 | 2,020 | 2,251 | 2,849 | 1,741 | 3,108 | 2,952 | 2,988 | 3,956 | 3,477 | 3,433 | 3,268 | 3,149 |
| 2017 | 2,888 | 4,617 | 2,748 | 3,888 | 3,132 | 3,120 | 2,789 | 4,620 | 4,049 | 4,594 | 3,579 | 2,641 |
| 2018 | 2,818 | 2,130 | 2,243 | 2,806 | 3,139 | 2,932 | 3,773 | 3,367 | 4,097 | 4,074 | 3,044 | 3,621 |
| 2019 | 3,082 | 2,279 | 2,703 | 3,065 | 3,086 | 3,557 | 3,027 | 3,854 | 4,456 | 3,022 | 4,170 | 3,188 |
| 2020 | 4,165 | 3,082 | 2,402 | 2,257 | 2,056 | 2,925 | 2,314 | 2,371 | 4,134 | 3,282 | 1,177 | 1,291 |
| 2021 | 1,360 | 1,216 | 968 | 1,132 | 1,193 | 1,387 | 1,457 | 1,323 | 1,588 | 1,125 | 1,114 | 1,301 |
| 2022 | 1,142 | 973 | 1,105 | 1,102 | 1,003 | 1,360 | 1,005 | 884 | 1,033 | 1,012 | 1,090 | 1,192 |
| 2023 | 1,048 | 970 | 1,054 | 1,139 | 892 | 622 | 957 | 1,103 | 1,125 | 1,041 | 995 | 848 |
| 2024 | 935 | 921 | 1,222 | 1,059 | 1,103 | 1,224 | ||||||
| - = No Data Reported; -- = Not Applicable; NA = Not Available; W = Withheld to avoid disclosure of individual company data. |
| Release Date: 8/30/2024 |
| Next Release Date: 9/30/2024 |