|
Download Data (XLS File) |
|
||||||||
|
||||||||
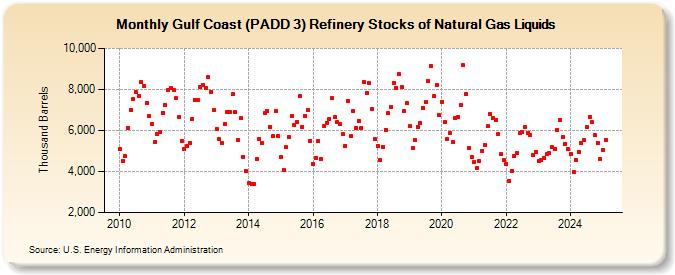
| Gulf Coast (PADD 3) Refinery Stocks of Natural Gas Liquids (Thousand Barrels) | ||||||||
| Year | Jan | Feb | Mar | Apr | May | Jun | Jul | Aug | Sep | Oct | Nov | Dec |
|---|---|---|---|---|---|---|---|---|---|---|---|---|
| 2010 | 5,104 | 4,526 | 4,750 | 6,119 | 7,002 | 7,524 | 7,864 | 7,662 | 8,380 | 8,160 | 7,357 | 6,703 |
| 2011 | 6,316 | 5,441 | 5,810 | 5,908 | 6,864 | 7,222 | 7,948 | 8,062 | 7,972 | 7,561 | 6,657 | 5,496 |
| 2012 | 5,117 | 5,222 | 5,401 | 6,575 | 7,509 | 7,509 | 8,105 | 8,228 | 8,080 | 8,616 | 7,894 | 6,998 |
| 2013 | 6,080 | 5,571 | 5,403 | 6,337 | 6,918 | 6,919 | 7,761 | 6,883 | 5,548 | 6,593 | 4,718 | 4,019 |
| 2014 | 3,419 | 3,384 | 3,374 | 4,604 | 5,594 | 5,384 | 6,836 | 6,967 | 6,188 | 5,715 | 6,955 | 5,712 |
| 2015 | 4,690 | 4,080 | 5,194 | 5,706 | 6,705 | 6,253 | 6,418 | 7,678 | 6,189 | 6,724 | 7,001 | 5,509 |
| 2016 | 4,358 | 4,665 | 5,490 | 4,590 | 6,194 | 6,383 | 6,563 | 7,560 | 6,667 | 6,396 | 6,316 | 5,828 |
| 2017 | 5,256 | 7,457 | 5,739 | 6,951 | 6,121 | 6,482 | 6,133 | 8,367 | 7,850 | 8,294 | 7,060 | 5,588 |
| 2018 | 5,267 | 4,555 | 5,197 | 6,046 | 6,832 | 7,148 | 8,317 | 8,087 | 8,728 | 8,099 | 6,934 | 7,324 |
| 2019 | 6,198 | 5,125 | 5,517 | 6,187 | 6,358 | 7,114 | 7,388 | 8,421 | 9,131 | 7,678 | 8,226 | 6,757 |
| 2020 | 7,402 | 6,401 | 5,567 | 5,880 | 5,427 | 6,626 | 6,658 | 7,219 | 9,170 | 7,777 | 5,169 | 4,712 |
| 2021 | 4,454 | 4,174 | 4,503 | 4,994 | 5,297 | 6,197 | 6,815 | 6,619 | 6,497 | 5,809 | 4,835 | 4,568 |
| 2022 | 4,388 | 3,516 | 4,049 | 4,738 | 4,902 | 5,878 | 5,916 | 6,177 | 5,899 | 5,799 | 4,829 | 4,963 |
| 2023 | 4,496 | 4,538 | 4,625 | 4,850 | 4,909 | 5,179 | 5,112 | 6,034 | 6,523 | 5,661 | 5,357 | 5,087 |
| 2024 | 4,859 | |||||||||||
| - = No Data Reported; -- = Not Applicable; NA = Not Available; W = Withheld to avoid disclosure of individual company data. |
| Release Date: 3/29/2024 |
| Next Release Date: 4/30/2024 |