|
Download Data (XLS File) |
|
||||||||
|
||||||||
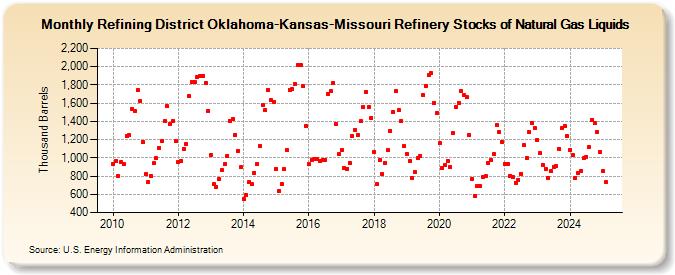
| Refining District Oklahoma-Kansas-Missouri Refinery Stocks of Natural Gas Liquids (Thousand Barrels) | ||||||||
| Year | Jan | Feb | Mar | Apr | May | Jun | Jul | Aug | Sep | Oct | Nov | Dec |
|---|---|---|---|---|---|---|---|---|---|---|---|---|
| 2010 | 934 | 961 | 799 | 953 | 929 | 1,238 | 1,253 | 1,540 | 1,517 | 1,745 | 1,624 | 1,171 |
| 2011 | 819 | 733 | 801 | 940 | 997 | 1,110 | 1,183 | 1,402 | 1,564 | 1,375 | 1,405 | 1,184 |
| 2012 | 949 | 965 | 1,101 | 1,154 | 1,682 | 1,835 | 1,827 | 1,883 | 1,894 | 1,892 | 1,822 | 1,516 |
| 2013 | 1,032 | 710 | 682 | 767 | 865 | 928 | 1,023 | 1,408 | 1,430 | 1,251 | 1,076 | 896 |
| 2014 | 551 | 594 | 733 | 712 | 835 | 932 | 1,131 | 1,579 | 1,522 | 1,747 | 1,630 | 1,615 |
| 2015 | 881 | 637 | 715 | 880 | 1,085 | 1,749 | 1,753 | 1,807 | 2,018 | 2,017 | 1,786 | 1,344 |
| 2016 | 930 | 977 | 986 | 988 | 962 | 981 | 977 | 1,705 | 1,730 | 1,824 | 1,373 | 1,037 |
| 2017 | 1,087 | 886 | 881 | 946 | 1,240 | 1,310 | 1,255 | 1,400 | 1,557 | 1,727 | 1,557 | 1,436 |
| 2018 | 1,064 | 710 | 974 | 823 | 947 | 1,083 | 1,298 | 1,508 | 1,732 | 1,523 | 1,405 | 1,125 |
| 2019 | 1,044 | 963 | 783 | 842 | 996 | 1,022 | 1,687 | 1,788 | 1,905 | 1,928 | 1,606 | 1,494 |
| 2020 | 1,158 | 893 | 919 | 966 | 898 | 1,272 | 1,556 | 1,605 | 1,732 | 1,685 | 1,663 | 1,255 |
| 2021 | 767 | 585 | 696 | 691 | 794 | 797 | 944 | 975 | 1,040 | 1,361 | 1,284 | 1,175 |
| 2022 | 932 | 930 | 804 | 792 | 729 | 757 | 826 | 1,141 | 1,002 | 1,284 | 1,383 | 1,328 |
| 2023 | 1,198 | 1,050 | 1,021 | 879 | 780 | 851 | 897 | 906 | 1,102 | 1,326 | 1,348 | 1,238 |
| 2024 | 1,090 | |||||||||||
| - = No Data Reported; -- = Not Applicable; NA = Not Available; W = Withheld to avoid disclosure of individual company data. |
| Release Date: 3/29/2024 |
| Next Release Date: 4/30/2024 |