|
Download Data (XLS File) |
|
||||||||
|
||||||||
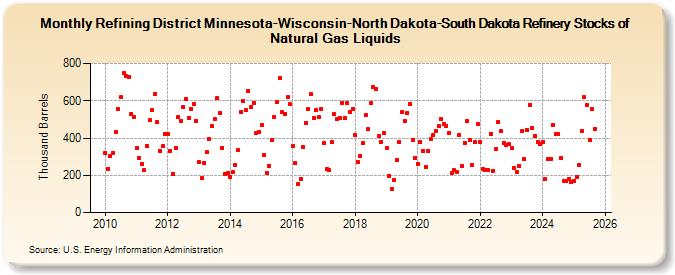
| Refining District Minnesota-Wisconsin-North Dakota-South Dakota Refinery Stocks of Natural Gas Liquids (Thousand Barrels) | ||||||||
| Year | Jan | Feb | Mar | Apr | May | Jun | Jul | Aug | Sep | Oct | Nov | Dec |
|---|---|---|---|---|---|---|---|---|---|---|---|---|
| 2010 | 319 | 233 | 306 | 322 | 433 | 554 | 619 | 750 | 731 | 730 | 529 | 515 |
| 2011 | 344 | 294 | 262 | 227 | 359 | 496 | 553 | 635 | 484 | 329 | 355 | 420 |
| 2012 | 420 | 332 | 208 | 347 | 515 | 493 | 569 | 612 | 509 | 558 | 581 | 493 |
| 2013 | 269 | 183 | 267 | 323 | 394 | 464 | 503 | 614 | 534 | 347 | 208 | 214 |
| 2014 | 193 | 218 | 256 | 334 | 541 | 598 | 549 | 652 | 566 | 589 | 427 | 433 |
| 2015 | 469 | 311 | 214 | 250 | 390 | 511 | 593 | 724 | 539 | 529 | 618 | 581 |
| 2016 | 356 | 266 | 151 | 181 | 352 | 483 | 556 | 634 | 507 | 550 | 511 | 557 |
| 2017 | 373 | 235 | 228 | 376 | 527 | 503 | 509 | 587 | 506 | 586 | 539 | 555 |
| 2018 | 416 | 271 | 305 | 372 | 523 | 446 | 587 | 675 | 662 | 409 | 380 | 429 |
| 2019 | 348 | 197 | 128 | 176 | 281 | 379 | 540 | 490 | 535 | 580 | 390 | 294 |
| 2020 | 261 | 381 | 329 | 245 | 333 | 395 | 415 | 438 | 462 | 501 | 475 | 466 |
| 2021 | 429 | 210 | 227 | 215 | 418 | 249 | 375 | 489 | 390 | 253 | 376 | 475 |
| 2022 | 381 | 236 | 231 | 231 | 423 | 225 | 343 | 484 | 437 | 372 | 362 | 370 |
| 2023 | 346 | 237 | 216 | 226 | 422 | 256 | 442 | 579 | 452 | 411 | 381 | 366 |
| 2024 | 380 | |||||||||||
| - = No Data Reported; -- = Not Applicable; NA = Not Available; W = Withheld to avoid disclosure of individual company data. |
| Release Date: 3/29/2024 |
| Next Release Date: 4/30/2024 |