|
Download Data (XLS File) |
|
||||||||
|
||||||||
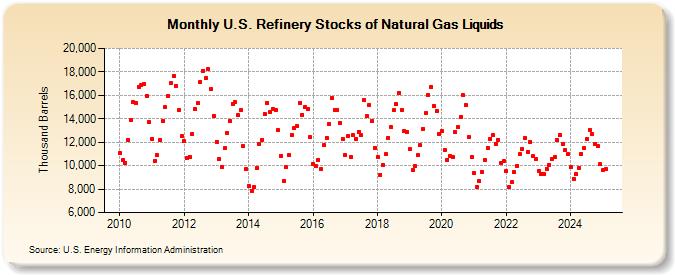
| U.S. Refinery Stocks of Natural Gas Liquids (Thousand Barrels) | ||||||||
| Year | Jan | Feb | Mar | Apr | May | Jun | Jul | Aug | Sep | Oct | Nov | Dec |
|---|---|---|---|---|---|---|---|---|---|---|---|---|
| 2010 | 11,071 | 10,495 | 10,254 | 12,206 | 13,884 | 15,409 | 15,301 | 16,739 | 16,858 | 16,960 | 15,965 | 13,696 |
| 2011 | 12,243 | 10,402 | 10,885 | 12,174 | 13,812 | 14,978 | 15,965 | 17,018 | 17,664 | 16,827 | 14,722 | 12,525 |
| 2012 | 12,073 | 10,612 | 10,777 | 12,722 | 14,813 | 15,361 | 17,145 | 18,114 | 17,468 | 18,220 | 16,538 | 14,230 |
| 2013 | 12,046 | 10,557 | 9,918 | 11,473 | 12,793 | 13,817 | 15,294 | 15,404 | 14,283 | 14,740 | 11,642 | 9,716 |
| 2014 | 8,272 | 7,875 | 8,180 | 9,820 | 11,833 | 12,228 | 14,421 | 15,365 | 14,557 | 14,841 | 14,724 | 13,019 |
| 2015 | 10,855 | 8,705 | 9,850 | 10,907 | 12,602 | 13,198 | 13,362 | 15,373 | 14,343 | 15,044 | 14,793 | 12,410 |
| 2016 | 10,146 | 9,956 | 10,500 | 9,686 | 11,727 | 12,380 | 13,534 | 15,803 | 14,750 | 14,736 | 13,672 | 12,294 |
| 2017 | 10,881 | 12,522 | 10,747 | 12,593 | 12,305 | 12,895 | 12,588 | 15,565 | 14,252 | 15,156 | 13,823 | 11,532 |
| 2018 | 10,777 | 9,240 | 10,067 | 10,971 | 12,397 | 13,265 | 14,745 | 15,246 | 16,235 | 14,784 | 12,994 | 12,867 |
| 2019 | 11,384 | 9,618 | 9,946 | 10,896 | 11,734 | 13,148 | 14,480 | 16,037 | 16,740 | 15,109 | 14,666 | 12,737 |
| 2020 | 12,967 | 11,296 | 10,523 | 10,815 | 10,719 | 12,891 | 13,293 | 14,129 | 16,000 | 15,152 | 12,421 | 10,726 |
| 2021 | 9,358 | 8,184 | 8,685 | 9,495 | 10,513 | 11,520 | 12,274 | 12,585 | 11,854 | 12,227 | 10,239 | 10,393 |
| 2022 | 9,517 | 8,171 | 8,568 | 9,438 | 9,996 | 10,989 | 11,428 | 12,347 | 11,187 | 12,025 | 10,797 | 10,576 |
| 2023 | 9,582 | 9,292 | 9,348 | 9,711 | 10,071 | 10,496 | 10,750 | 12,145 | 12,591 | 11,824 | 11,357 | 10,978 |
| 2024 | 9,871 | |||||||||||
| - = No Data Reported; -- = Not Applicable; NA = Not Available; W = Withheld to avoid disclosure of individual company data. |
| Release Date: 3/29/2024 |
| Next Release Date: 4/30/2024 |