|
Download Data (XLS File) |
|
||||||||
|
||||||||
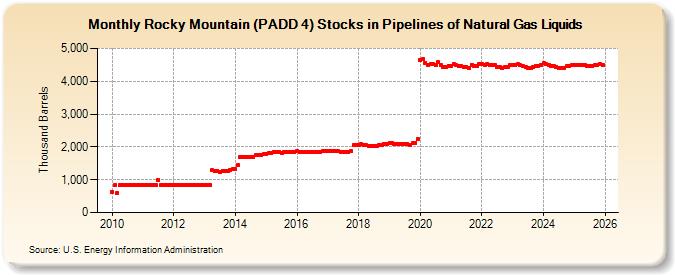
| Rocky Mountain (PADD 4) Stocks in Pipelines of Natural Gas Liquids (Thousand Barrels) | ||||||||
| Year | Jan | Feb | Mar | Apr | May | Jun | Jul | Aug | Sep | Oct | Nov | Dec |
|---|---|---|---|---|---|---|---|---|---|---|---|---|
| 2010 | 641 | 833 | 593 | 834 | 833 | 833 | 835 | 835 | 833 | 844 | 835 | 846 |
| 2011 | 847 | 847 | 842 | 834 | 834 | 834 | 990 | 838 | 844 | 844 | 843 | 843 |
| 2012 | 843 | 844 | 841 | 835 | 833 | 834 | 834 | 835 | 834 | 834 | 834 | 835 |
| 2013 | 834 | 834 | 834 | 1,284 | 1,280 | 1,278 | 1,244 | 1,279 | 1,279 | 1,263 | 1,308 | 1,315 |
| 2014 | 1,321 | 1,458 | 1,695 | 1,690 | 1,691 | 1,688 | 1,687 | 1,692 | 1,740 | 1,753 | 1,764 | 1,781 |
| 2015 | 1,796 | 1,803 | 1,808 | 1,848 | 1,853 | 1,855 | 1,819 | 1,854 | 1,840 | 1,843 | 1,832 | 1,833 |
| 2016 | 1,873 | 1,854 | 1,851 | 1,857 | 1,853 | 1,850 | 1,849 | 1,858 | 1,851 | 1,856 | 1,871 | 1,881 |
| 2017 | 1,885 | 1,887 | 1,886 | 1,883 | 1,871 | 1,855 | 1,842 | 1,848 | 1,853 | 1,865 | 2,056 | 2,062 |
| 2018 | 2,070 | 2,073 | 2,044 | 2,045 | 2,036 | 2,038 | 2,021 | 2,028 | 2,051 | 2,063 | 2,082 | 2,085 |
| 2019 | 2,121 | 2,124 | 2,096 | 2,092 | 2,092 | 2,090 | 2,086 | 2,086 | 2,056 | 2,107 | 2,129 | 2,231 |
| 2020 | 4,640 | 4,665 | 4,568 | 4,509 | 4,520 | 4,512 | 4,495 | 4,576 | 4,488 | 4,430 | 4,444 | 4,457 |
| 2021 | 4,476 | 4,518 | 4,480 | 4,463 | 4,458 | 4,440 | 4,440 | 4,412 | 4,507 | 4,462 | 4,469 | 4,525 |
| 2022 | 4,536 | 4,509 | 4,536 | 4,496 | 4,484 | 4,486 | 4,424 | 4,418 | 4,413 | 4,426 | 4,447 | 4,483 |
| 2023 | 4,492 | 4,503 | 4,510 | 4,484 | 4,451 | 4,421 | 4,416 | 4,410 | 4,421 | 4,457 | 4,473 | 4,489 |
| 2024 | 5,447 | 4,515 | 4,507 | 4,473 | ||||||||
| - = No Data Reported; -- = Not Applicable; NA = Not Available; W = Withheld to avoid disclosure of individual company data. |
| Release Date: 6/28/2024 |
| Next Release Date: 7/31/2024 |