|
Download Data (XLS File) |
|
||||||||
|
||||||||
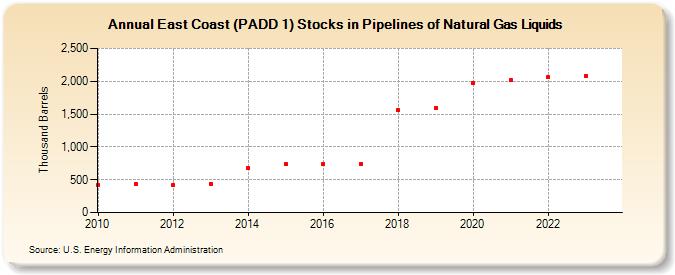
| East Coast (PADD 1) Stocks in Pipelines of Natural Gas Liquids (Thousand Barrels) | ||||||||
| Decade | Year-0 | Year-1 | Year-2 | Year-3 | Year-4 | Year-5 | Year-6 | Year-7 | Year-8 | Year-9 |
|---|---|---|---|---|---|---|---|---|---|---|
| 2010's | 422 | 435 | 423 | 440 | 673 | 736 | 742 | 737 | 1,559 | 1,599 |
| 2020's | 1,979 | 2,017 | 2,060 | 2,082 |
| - = No Data Reported; -- = Not Applicable; NA = Not Available; W = Withheld to avoid disclosure of individual company data. |
| Release Date: 3/29/2024 |
| Next Release Date: 8/30/2024 |