|
Download Data (XLS File) |
|
||||||||
|
||||||||
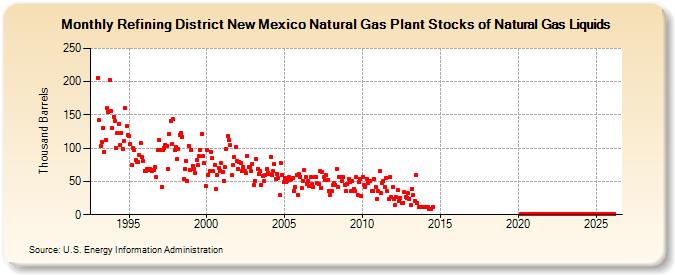
| Refining District New Mexico Natural Gas Plant Stocks of Natural Gas Liquids (Thousand Barrels) | ||||||||
| Year | Jan | Feb | Mar | Apr | May | Jun | Jul | Aug | Sep | Oct | Nov | Dec |
|---|---|---|---|---|---|---|---|---|---|---|---|---|
| 1993 | 206 | 142 | 103 | 110 | 130 | 94 | 113 | 160 | 155 | 203 | 156 | 130 |
| 1994 | 147 | 141 | 101 | 123 | 136 | 105 | 123 | 99 | 111 | 161 | 134 | 120 |
| 1995 | 118 | 106 | 74 | 101 | 97 | 82 | 79 | 79 | 90 | 108 | 86 | 80 |
| 1996 | 65 | 66 | 68 | 67 | 68 | 67 | 66 | 67 | 71 | 56 | 97 | 113 |
| 1997 | 98 | 42 | 98 | 101 | 105 | 103 | 69 | 121 | 141 | 106 | 144 | 97 |
| 1998 | 102 | 84 | 99 | 120 | 123 | 117 | 54 | 69 | 81 | 51 | 104 | 67 |
| 1999 | 97 | 73 | 68 | 62 | 82 | 74 | 88 | 98 | 122 | 89 | 77 | 43 |
| 2000 | 98 | 60 | 65 | 95 | 85 | 65 | 75 | 38 | 60 | 70 | 66 | 77 |
| 2001 | 64 | 50 | 71 | 99 | 118 | 112 | 105 | 59 | 75 | 87 | 102 | 80 |
| 2002 | 69 | 79 | 78 | 65 | 72 | 65 | 62 | 89 | 71 | 71 | 65 | 76 |
| 2003 | 44 | 51 | 84 | 69 | 61 | 65 | 45 | 58 | 50 | 60 | 68 | 63 |
| 2004 | 61 | 87 | 59 | 65 | 76 | 53 | 61 | 55 | 29 | 78 | 60 | 49 |
| 2005 | 55 | 49 | 51 | 56 | 52 | 54 | 55 | 36 | 42 | 59 | 30 | 61 |
| 2006 | 57 | 40 | 51 | 67 | 57 | 46 | 51 | 43 | 56 | 46 | 41 | 56 |
| 2007 | 56 | 48 | 46 | 65 | 40 | 64 | 56 | 52 | 59 | 52 | 35 | 30 |
| 2008 | 35 | 45 | 47 | 45 | 69 | 42 | 56 | 57 | 51 | 57 | 45 | 35 |
| 2009 | 46 | 54 | 49 | 35 | 50 | 39 | 36 | 56 | 29 | 49 | 53 | 28 |
| 2010 | 57 | 44 | 42 | 53 | 48 | 50 | 50 | 36 | 35 | 54 | 42 | 24 |
| 2011 | 35 | 65 | 32 | 47 | 50 | 42 | 55 | 35 | 23 | 56 | 26 | 41 |
| 2012 | 24 | 14 | 26 | 37 | 20 | 25 | 18 | 18 | 34 | 27 | 25 | 32 |
| 2013 | 24 | 14 | 39 | 29 | 21 | 59 | 18 | 11 | 11 | 11 | 11 | 11 |
| 2014 | 11 | 11 | 11 | 9 | 9 | 9 | 12 | |||||
| 2020 | 1 | 1 | 1 | 1 | 1 | 1 | 1 | 1 | 1 | 1 | ||
| 2021 | 1 | 1 | 1 | 1 | 1 | 1 | 1 | 1 | 1 | 1 | 1 | 1 |
| 2022 | 1 | 1 | 1 | 1 | 1 | 1 | 1 | 1 | 1 | 1 | 1 | 1 |
| 2023 | 1 | 1 | 1 | 1 | 1 | 1 | 1 | 1 | 1 | 1 | 1 | |
| - = No Data Reported; -- = Not Applicable; NA = Not Available; W = Withheld to avoid disclosure of individual company data. |
| Release Date: 3/29/2024 |
| Next Release Date: 4/30/2024 |