|
Download Data (XLS File) |
|
||||||||
|
||||||||
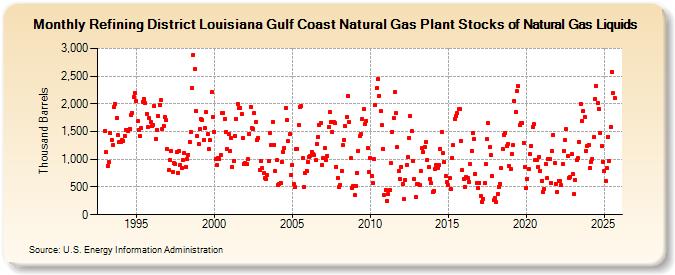
| Refining District Louisiana Gulf Coast Natural Gas Plant Stocks of Natural Gas Liquids (Thousand Barrels) | ||||||||
| Year | Jan | Feb | Mar | Apr | May | Jun | Jul | Aug | Sep | Oct | Nov | Dec |
|---|---|---|---|---|---|---|---|---|---|---|---|---|
| 1993 | 1,515 | 1,127 | 882 | 950 | 1,470 | 1,354 | 1,254 | 1,948 | 2,002 | 1,741 | 1,429 | 1,313 |
| 1994 | 1,320 | 1,350 | 1,335 | 1,425 | 1,537 | 1,526 | 1,506 | 1,555 | 1,800 | 1,843 | 2,128 | 2,202 |
| 1995 | 2,049 | 1,685 | 1,528 | 1,418 | 1,573 | 2,035 | 2,090 | 2,009 | 1,823 | 1,580 | 1,739 | 1,678 |
| 1996 | 1,603 | 1,624 | 1,961 | 1,374 | 1,537 | 1,783 | 1,983 | 2,069 | 1,543 | 1,607 | 1,765 | 1,701 |
| 1997 | 1,189 | 799 | 983 | 1,143 | 777 | 941 | 907 | 1,126 | 759 | 1,150 | 896 | 835 |
| 1998 | 978 | 1,114 | 857 | 997 | 1,085 | 1,315 | 1,497 | 2,290 | 2,887 | 2,627 | 1,872 | 1,411 |
| 1999 | 1,275 | 1,543 | 1,728 | 1,711 | 1,344 | 1,562 | 1,851 | 1,448 | 1,177 | 1,345 | 2,205 | 1,769 |
| 2000 | 1,499 | 1,008 | 895 | 1,029 | 1,007 | 1,083 | 1,830 | 1,837 | 1,728 | 1,498 | 1,183 | 1,448 |
| 2001 | 1,153 | 1,384 | 855 | 974 | 1,411 | 1,732 | 2,004 | 1,923 | 1,927 | 1,820 | 1,382 | 921 |
| 2002 | 937 | 911 | 1,000 | 1,463 | 1,943 | 1,563 | 1,551 | 1,826 | 1,678 | 1,339 | 1,385 | 808 |
| 2003 | 973 | 843 | 747 | 660 | 643 | 712 | 972 | 1,475 | 1,255 | 1,675 | 1,262 | 788 |
| 2004 | 981 | 542 | 545 | 577 | 959 | 1,129 | 1,197 | 1,931 | 1,708 | 1,328 | 1,455 | 717 |
| 2005 | 905 | 556 | 496 | 1,181 | 1,184 | 1,612 | 1,951 | 1,961 | 1,020 | 496 | 746 | 794 |
| 2006 | 954 | 1,050 | 1,062 | 1,135 | 1,100 | 1,073 | 979 | 1,278 | 1,410 | 1,622 | 1,658 | 905 |
| 2007 | 1,026 | 1,202 | 981 | 1,064 | 1,574 | 1,856 | 1,678 | 1,493 | 1,679 | 1,652 | 867 | 664 |
| 2008 | 498 | 536 | 785 | 1,250 | 1,354 | 1,594 | 1,766 | 2,144 | 1,672 | 1,014 | 482 | 516 |
| 2009 | 355 | 525 | 760 | 1,158 | 1,415 | 1,456 | 1,727 | 1,900 | 1,633 | 1,695 | 1,197 | 774 |
| 2010 | 1,031 | 707 | 576 | 1,000 | 1,979 | 2,277 | 2,444 | 2,150 | 1,868 | 1,612 | 1,189 | 363 |
| 2011 | 449 | 255 | 374 | 437 | 937 | 1,498 | 1,747 | 2,219 | 1,837 | 1,219 | 781 | 640 |
| 2012 | 866 | 546 | 278 | 633 | 905 | 1,034 | 1,389 | 1,776 | 1,505 | 967 | 640 | 327 |
| 2013 | 556 | 548 | 533 | 797 | 1,196 | 1,130 | 1,224 | 1,320 | 992 | 852 | 651 | 564 |
| 2014 | 409 | 433 | 827 | 892 | 843 | 896 | 1,194 | 1,496 | 1,107 | 951 | 699 | 583 |
| 2015 | 533 | 663 | 472 | 1,026 | 1,249 | 1,726 | 1,773 | 1,826 | 1,904 | 1,904 | 1,335 | 806 |
| 2016 | 641 | 505 | 683 | 662 | 587 | 906 | 1,151 | 1,469 | 1,369 | 740 | 574 | 480 |
| 2017 | 580 | 344 | 236 | 292 | 570 | 910 | 1,361 | 1,646 | 1,217 | 1,077 | 701 | 262 |
| 2018 | 303 | 229 | 373 | 500 | 563 | 835 | 1,188 | 1,443 | 1,479 | 1,232 | 1,284 | 883 |
| 2019 | 822 | 1,101 | 1,255 | 2,057 | 1,854 | 2,231 | 2,324 | 1,610 | 1,652 | 1,656 | 1,301 | 865 |
| 2020 | 488 | 652 | 828 | 1,090 | 1,240 | 1,583 | 1,636 | 979 | 978 | 862 | 1,044 | 797 |
| 2021 | 617 | 413 | 463 | 914 | 662 | 1,000 | 1,001 | 581 | 1,146 | 1,429 | 933 | 563 |
| 2022 | 415 | 614 | 615 | 529 | 921 | 1,158 | 1,349 | 1,538 | 1,053 | 668 | 687 | 1,093 |
| 2023 | 733 | 380 | 624 | 982 | 1,014 | 1,309 | 2,005 | 1,691 | 1,875 | 1,769 | 1,156 | 1,241 |
| 2024 | 1,264 | |||||||||||
| - = No Data Reported; -- = Not Applicable; NA = Not Available; W = Withheld to avoid disclosure of individual company data. |
| Release Date: 3/29/2024 |
| Next Release Date: 4/30/2024 |