|
Download Data (XLS File) |
|
||||||||
|
||||||||
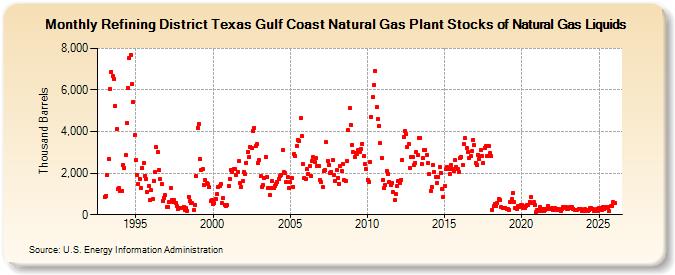
| Refining District Texas Gulf Coast Natural Gas Plant Stocks of Natural Gas Liquids (Thousand Barrels) | ||||||||
| Year | Jan | Feb | Mar | Apr | May | Jun | Jul | Aug | Sep | Oct | Nov | Dec |
|---|---|---|---|---|---|---|---|---|---|---|---|---|
| 1993 | 830 | 920 | 1,912 | 2,681 | 6,049 | 6,885 | 6,652 | 6,521 | 5,231 | 4,101 | 1,233 | 1,280 |
| 1994 | 1,154 | 1,164 | 2,400 | 2,267 | 2,853 | 4,421 | 6,090 | 7,535 | 7,702 | 6,276 | 5,422 | 3,825 |
| 1995 | 2,609 | 1,925 | 1,501 | 1,735 | 1,263 | 2,256 | 2,502 | 1,881 | 1,726 | 1,101 | 1,373 | 721 |
| 1996 | 1,166 | 741 | 1,631 | 2,042 | 3,236 | 3,010 | 2,147 | 1,704 | 1,493 | 655 | 804 | 932 |
| 1997 | 379 | 369 | 624 | 1,302 | 712 | 635 | 685 | 543 | 402 | 277 | 304 | 346 |
| 1998 | 309 | 383 | 218 | 332 | 201 | 876 | 665 | 543 | 542 | 220 | 470 | 1,864 |
| 1999 | 4,193 | 4,363 | 2,677 | 2,145 | 2,176 | 1,437 | 1,673 | 1,543 | 1,458 | 1,315 | 658 | 711 |
| 2000 | 511 | 542 | 761 | 974 | 1,347 | 1,368 | 1,492 | 554 | 802 | 459 | 431 | 450 |
| 2001 | 1,386 | 1,723 | 2,145 | 2,045 | 2,186 | 2,190 | 1,930 | 2,044 | 2,581 | 1,531 | 1,346 | 1,642 |
| 2002 | 2,039 | 1,964 | 2,505 | 3,011 | 2,762 | 3,274 | 3,222 | 4,047 | 4,191 | 3,299 | 3,382 | 2,507 |
| 2003 | 2,613 | 1,850 | 1,353 | 1,436 | 1,742 | 2,784 | 1,801 | 1,307 | 953 | 1,281 | 1,605 | 1,283 |
| 2004 | 1,386 | 1,476 | 1,563 | 1,726 | 1,849 | 1,930 | 3,090 | 2,041 | 1,995 | 1,581 | 1,793 | 1,272 |
| 2005 | 1,551 | 1,767 | 1,346 | 2,926 | 2,803 | 3,312 | 3,575 | 3,569 | 4,635 | 3,790 | 2,438 | 1,762 |
| 2006 | 1,712 | 2,186 | 1,950 | 2,348 | 1,870 | 2,583 | 2,753 | 2,538 | 2,711 | 2,353 | 2,355 | 1,675 |
| 2007 | 1,568 | 1,324 | 2,092 | 2,154 | 3,475 | 2,601 | 2,404 | 2,012 | 2,060 | 2,623 | 1,902 | 1,609 |
| 2008 | 2,135 | 1,789 | 1,499 | 2,335 | 2,123 | 2,436 | 1,666 | 1,639 | 2,590 | 4,052 | 5,117 | 4,334 |
| 2009 | 3,372 | 3,014 | 2,781 | 2,976 | 2,918 | 3,103 | 3,004 | 3,167 | 3,422 | 2,804 | 2,446 | 2,181 |
| 2010 | 1,686 | 1,586 | 2,540 | 4,712 | 5,655 | 6,243 | 6,926 | 5,165 | 4,593 | 4,271 | 3,430 | 2,738 |
| 2011 | 1,680 | 1,291 | 1,449 | 2,100 | 1,980 | 1,581 | 1,437 | 1,540 | 1,088 | 688 | 982 | 1,388 |
| 2012 | 1,601 | 1,514 | 1,686 | 2,643 | 3,751 | 4,024 | 3,862 | 3,240 | 3,398 | 2,244 | 2,761 | 2,762 |
| 2013 | 2,414 | 2,501 | 3,015 | 2,862 | 3,667 | 3,691 | 2,441 | 2,713 | 3,123 | 3,127 | 2,873 | 2,472 |
| 2014 | 1,956 | 1,149 | 1,334 | 2,369 | 2,059 | 1,819 | 1,546 | 1,811 | 2,312 | 2,010 | 1,244 | 876 |
| 2015 | 1,360 | 2,191 | 2,284 | 2,193 | 1,950 | 2,374 | 2,206 | 2,092 | 2,623 | 2,295 | 2,176 | 2,039 |
| 2016 | 2,716 | 2,781 | 2,397 | 3,389 | 3,672 | 3,205 | 2,994 | 2,717 | 2,817 | 3,050 | 3,615 | 3,348 |
| 2017 | 2,499 | 2,382 | 2,883 | 2,663 | 3,120 | 2,841 | 2,494 | 3,209 | 3,284 | 2,839 | 3,294 | 2,951 |
| 2018 | 2,803 | 242 | 401 | 524 | 438 | 577 | 753 | 700 | 356 | 338 | 337 | 329 |
| 2019 | 265 | 277 | 238 | 614 | 765 | 1,060 | 592 | 322 | 277 | 423 | 394 | 464 |
| 2020 | 468 | 308 | 340 | 398 | 478 | 455 | 626 | 831 | 576 | 594 | 486 | 141 |
| 2021 | 231 | 170 | 359 | 180 | 298 | 196 | 242 | 292 | 409 | 260 | 256 | 302 |
| 2022 | 238 | 234 | 316 | 243 | 290 | 242 | 186 | 297 | 353 | 338 | 355 | 277 |
| 2023 | 297 | 358 | 330 | 373 | 289 | 234 | 242 | 231 | 268 | 281 | 254 | 185 |
| 2024 | 189 | |||||||||||
| - = No Data Reported; -- = Not Applicable; NA = Not Available; W = Withheld to avoid disclosure of individual company data. |
| Release Date: 3/29/2024 |
| Next Release Date: 4/30/2024 |