|
Download Data (XLS File) |
|
||||||||
|
||||||||
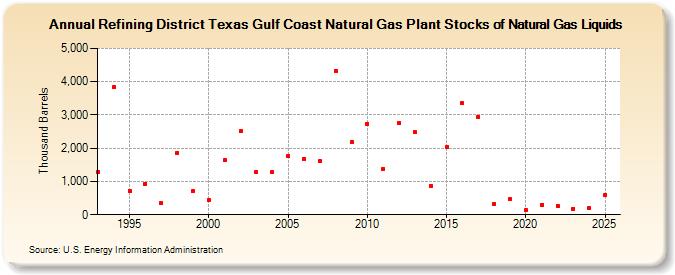
| Refining District Texas Gulf Coast Natural Gas Plant Stocks of Natural Gas Liquids (Thousand Barrels) | ||||||||
| Decade | Year-0 | Year-1 | Year-2 | Year-3 | Year-4 | Year-5 | Year-6 | Year-7 | Year-8 | Year-9 |
|---|---|---|---|---|---|---|---|---|---|---|
| 1990's | 1,280 | 3,825 | 721 | 932 | 346 | 1,864 | 711 | |||
| 2000's | 450 | 1,642 | 2,507 | 1,283 | 1,272 | 1,762 | 1,675 | 1,609 | 4,334 | 2,181 |
| 2010's | 2,738 | 1,388 | 2,762 | 2,472 | 876 | 2,039 | 3,348 | 2,951 | 329 | 464 |
| 2020's | 141 | 302 | 277 | 185 |
| - = No Data Reported; -- = Not Applicable; NA = Not Available; W = Withheld to avoid disclosure of individual company data. |
| Release Date: 6/28/2024 |
| Next Release Date: 8/30/2024 |