|
Download Data (XLS File) |
|
||||||||
|
||||||||
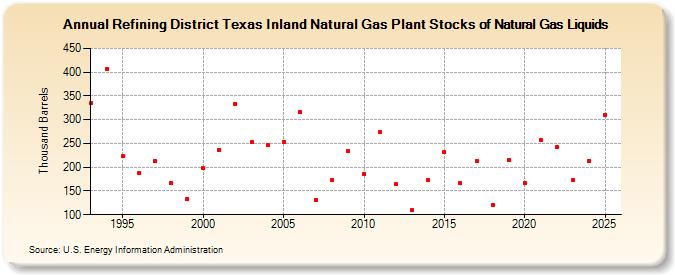
| Refining District Texas Inland Natural Gas Plant Stocks of Natural Gas Liquids (Thousand Barrels) | ||||||||
| Decade | Year-0 | Year-1 | Year-2 | Year-3 | Year-4 | Year-5 | Year-6 | Year-7 | Year-8 | Year-9 |
|---|---|---|---|---|---|---|---|---|---|---|
| 1990's | 335 | 407 | 223 | 187 | 214 | 166 | 134 | |||
| 2000's | 198 | 236 | 333 | 252 | 246 | 254 | 316 | 132 | 174 | 235 |
| 2010's | 185 | 274 | 164 | 109 | 174 | 232 | 166 | 212 | 120 | 215 |
| 2020's | 167 | 258 | 243 | 173 |
| - = No Data Reported; -- = Not Applicable; NA = Not Available; W = Withheld to avoid disclosure of individual company data. |
| Release Date: 3/29/2024 |
| Next Release Date: 8/30/2024 |