|
Download Data (XLS File) |
|
||||||||
|
||||||||
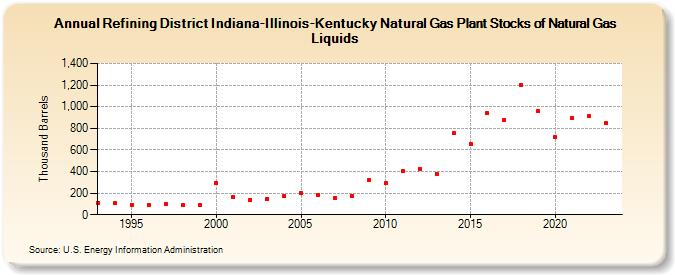
| Refining District Indiana-Illinois-Kentucky Natural Gas Plant Stocks of Natural Gas Liquids (Thousand Barrels) | ||||||||
| Decade | Year-0 | Year-1 | Year-2 | Year-3 | Year-4 | Year-5 | Year-6 | Year-7 | Year-8 | Year-9 |
|---|---|---|---|---|---|---|---|---|---|---|
| 1990's | 111 | 108 | 94 | 92 | 102 | 86 | 90 | |||
| 2000's | 290 | 162 | 139 | 149 | 172 | 197 | 186 | 158 | 177 | 317 |
| 2010's | 290 | 405 | 423 | 374 | 753 | 656 | 938 | 881 | 1,203 | 956 |
| 2020's | 719 | 898 | 911 | 847 |
| - = No Data Reported; -- = Not Applicable; NA = Not Available; W = Withheld to avoid disclosure of individual company data. |
| Release Date: 3/29/2024 |
| Next Release Date: 8/30/2024 |