|
Download Data (XLS File) |
|
||||||||
|
||||||||
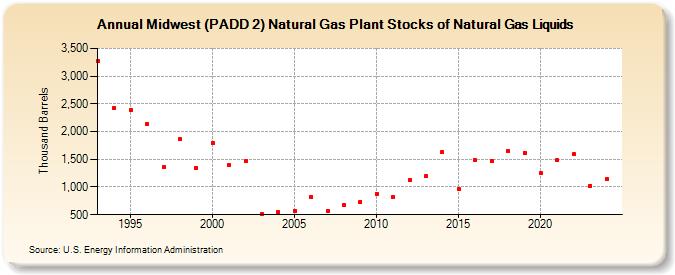
| Midwest (PADD 2) Natural Gas Plant Stocks of Natural Gas Liquids (Thousand Barrels) | ||||||||
| Decade | Year-0 | Year-1 | Year-2 | Year-3 | Year-4 | Year-5 | Year-6 | Year-7 | Year-8 | Year-9 |
|---|---|---|---|---|---|---|---|---|---|---|
| 1990's | 3,273 | 2,433 | 2,394 | 2,133 | 1,360 | 1,865 | 1,349 | |||
| 2000's | 1,789 | 1,393 | 1,460 | 518 | 545 | 576 | 822 | 574 | 671 | 735 |
| 2010's | 879 | 818 | 1,122 | 1,196 | 1,630 | 955 | 1,478 | 1,460 | 1,645 | 1,620 |
| 2020's | 1,250 | 1,481 | 1,590 | 1,022 |
| - = No Data Reported; -- = Not Applicable; NA = Not Available; W = Withheld to avoid disclosure of individual company data. |
| Release Date: 3/29/2024 |
| Next Release Date: 8/30/2024 |