|
Download Data (XLS File) |
|
||||||||
|
||||||||
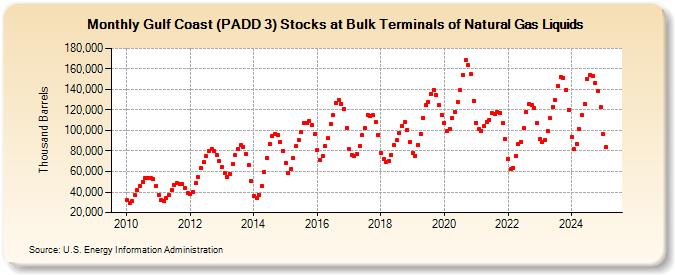
| Gulf Coast (PADD 3) Stocks at Bulk Terminals of Natural Gas Liquids (Thousand Barrels) | ||||||||
| Year | Jan | Feb | Mar | Apr | May | Jun | Jul | Aug | Sep | Oct | Nov | Dec |
|---|---|---|---|---|---|---|---|---|---|---|---|---|
| 2010 | 31,883 | 28,853 | 31,051 | 37,083 | 41,571 | 46,198 | 50,144 | 53,856 | 53,564 | 53,446 | 52,342 | 46,077 |
| 2011 | 37,026 | 32,465 | 31,237 | 34,342 | 37,261 | 42,156 | 46,959 | 48,435 | 47,651 | 47,412 | 43,776 | 39,028 |
| 2012 | 37,928 | 40,360 | 48,523 | 54,338 | 63,235 | 69,270 | 74,944 | 80,370 | 81,974 | 79,568 | 76,305 | 69,820 |
| 2013 | 64,072 | 58,215 | 54,201 | 57,649 | 67,562 | 75,654 | 81,927 | 85,717 | 84,155 | 77,119 | 65,925 | 51,241 |
| 2014 | 36,475 | 34,424 | 37,581 | 46,084 | 59,662 | 73,202 | 87,014 | 95,053 | 96,894 | 95,533 | 89,028 | 80,475 |
| 2015 | 68,430 | 58,440 | 62,130 | 72,719 | 84,927 | 90,883 | 98,071 | 106,864 | 107,245 | 109,366 | 104,904 | 96,194 |
| 2016 | 80,618 | 71,167 | 74,758 | 84,800 | 92,473 | 106,122 | 115,189 | 126,676 | 129,488 | 126,221 | 120,841 | 102,531 |
| 2017 | 81,681 | 76,219 | 74,980 | 76,700 | 85,018 | 95,105 | 102,109 | 115,150 | 113,714 | 114,672 | 108,405 | 95,698 |
| 2018 | 78,163 | 71,986 | 69,668 | 70,162 | 76,476 | 85,452 | 90,617 | 97,860 | 104,505 | 108,099 | 100,936 | 89,224 |
| 2019 | 78,106 | 75,577 | 86,298 | 96,587 | 112,590 | 124,787 | 127,789 | 135,797 | 139,757 | 134,366 | 125,295 | 115,439 |
| 2020 | 107,289 | 99,198 | 101,213 | 112,467 | 117,789 | 127,602 | 139,161 | 154,364 | 168,342 | 163,395 | 154,813 | 129,058 |
| 2021 | 107,295 | 101,421 | 99,975 | 104,129 | 108,281 | 110,499 | 116,912 | 115,954 | 118,266 | 117,182 | 107,316 | 91,871 |
| 2022 | 72,610 | 61,991 | 63,843 | 75,257 | 87,106 | 89,094 | 102,008 | 117,903 | 125,713 | 125,029 | 121,711 | 107,463 |
| 2023 | 92,057 | 88,619 | 90,675 | 99,937 | 111,879 | 123,348 | 129,604 | 143,822 | 152,367 | 151,325 | 139,790 | 120,044 |
| 2024 | 93,669 | 81,656 | 87,210 | 101,262 | ||||||||
| - = No Data Reported; -- = Not Applicable; NA = Not Available; W = Withheld to avoid disclosure of individual company data. |
| Release Date: 6/28/2024 |
| Next Release Date: 7/31/2024 |