|
Download Data (XLS File) |
|
||||||||
|
||||||||
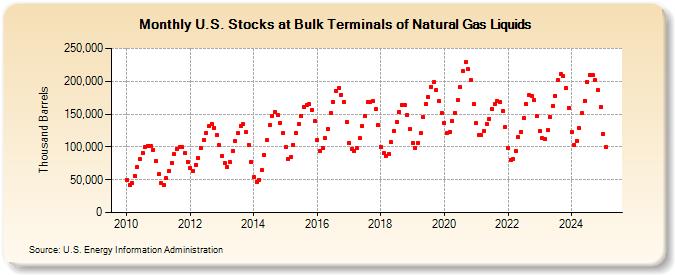
| U.S. Stocks at Bulk Terminals of Natural Gas Liquids (Thousand Barrels) | ||||||||
| Year | Jan | Feb | Mar | Apr | May | Jun | Jul | Aug | Sep | Oct | Nov | Dec |
|---|---|---|---|---|---|---|---|---|---|---|---|---|
| 2010 | 50,118 | 42,080 | 45,256 | 56,403 | 69,278 | 81,522 | 91,040 | 100,299 | 102,084 | 100,845 | 95,913 | 78,645 |
| 2011 | 58,182 | 44,798 | 42,438 | 51,929 | 62,881 | 75,990 | 88,603 | 97,258 | 99,709 | 99,205 | 90,348 | 77,726 |
| 2012 | 67,754 | 63,697 | 72,989 | 83,829 | 98,795 | 110,627 | 120,951 | 131,273 | 135,457 | 129,254 | 118,585 | 102,859 |
| 2013 | 86,584 | 74,873 | 69,664 | 76,962 | 93,794 | 109,135 | 120,712 | 132,410 | 134,109 | 121,945 | 103,011 | 77,373 |
| 2014 | 54,085 | 46,696 | 50,291 | 65,514 | 87,355 | 109,928 | 133,190 | 147,372 | 153,006 | 148,709 | 136,685 | 121,107 |
| 2015 | 99,391 | 80,883 | 85,352 | 103,348 | 121,440 | 134,369 | 147,196 | 160,676 | 164,278 | 164,757 | 156,631 | 139,448 |
| 2016 | 110,721 | 94,308 | 98,743 | 113,222 | 127,227 | 150,904 | 168,494 | 185,242 | 189,252 | 179,413 | 168,732 | 138,086 |
| 2017 | 106,327 | 97,038 | 93,057 | 97,964 | 113,514 | 132,023 | 146,945 | 167,753 | 168,244 | 170,240 | 157,248 | 133,288 |
| 2018 | 100,483 | 90,188 | 85,768 | 89,813 | 106,963 | 124,408 | 137,874 | 153,176 | 164,217 | 164,140 | 148,607 | 127,621 |
| 2019 | 106,665 | 97,655 | 106,418 | 120,539 | 145,346 | 165,500 | 175,601 | 191,837 | 198,362 | 186,751 | 169,135 | 151,310 |
| 2020 | 136,429 | 120,906 | 123,414 | 139,152 | 152,323 | 170,755 | 190,997 | 215,202 | 229,518 | 218,163 | 202,040 | 165,329 |
| 2021 | 135,919 | 118,750 | 117,684 | 124,488 | 135,199 | 143,017 | 157,641 | 164,912 | 169,804 | 168,242 | 153,938 | 130,077 |
| 2022 | 99,063 | 80,665 | 81,822 | 93,887 | 114,930 | 123,316 | 143,644 | 165,065 | 178,630 | 178,154 | 171,388 | 146,388 |
| 2023 | 124,284 | 113,414 | 111,340 | 124,939 | 144,824 | 162,183 | 178,449 | 201,080 | 211,141 | 207,800 | 189,694 | 159,731 |
| 2024 | 122,442 | |||||||||||
| - = No Data Reported; -- = Not Applicable; NA = Not Available; W = Withheld to avoid disclosure of individual company data. |
| Release Date: 3/29/2024 |
| Next Release Date: 4/30/2024 |