|
Download Data (XLS File) |
|
||||||||
|
||||||||
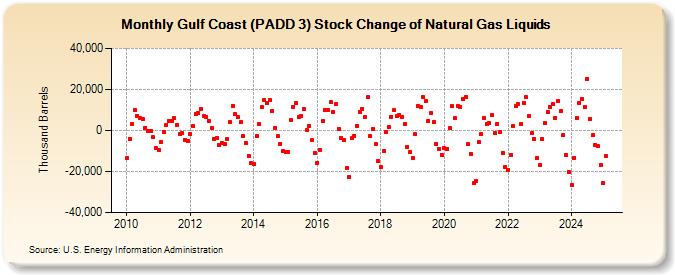
| Gulf Coast (PADD 3) Stock Change of Natural Gas Liquids (Thousand Barrels) | ||||||||
| Year | Jan | Feb | Mar | Apr | May | Jun | Jul | Aug | Sep | Oct | Nov | Dec |
|---|---|---|---|---|---|---|---|---|---|---|---|---|
| 2010 | -13,219 | -4,012 | 3,029 | 9,935 | 6,984 | 5,907 | 5,438 | 1,361 | -161 | -433 | -3,407 | -8,496 |
| 2011 | -9,444 | -5,515 | -752 | 2,855 | 4,739 | 4,825 | 5,979 | 2,748 | -1,634 | -1,011 | -4,694 | -5,071 |
| 2012 | -1,691 | 1,970 | 7,939 | 8,582 | 10,467 | 7,286 | 6,490 | 4,780 | 1,423 | -4,149 | -3,535 | -7,290 |
| 2013 | -6,336 | -6,665 | -4,139 | 4,171 | 12,144 | 7,900 | 6,383 | 3,998 | -2,863 | -6,123 | -12,373 | -15,697 |
| 2014 | -16,235 | -2,765 | 3,100 | 11,496 | 14,871 | 13,147 | 14,897 | 9,378 | 1,329 | -2,886 | -6,556 | -10,066 |
| 2015 | -10,724 | -10,385 | 5,017 | 11,493 | 13,149 | 6,690 | 6,931 | 10,240 | 88 | 2,084 | -4,873 | -10,741 |
| 2016 | -15,657 | -9,393 | 4,393 | 9,974 | 10,174 | 13,751 | 9,226 | 12,793 | 632 | -3,579 | -4,796 | -18,373 |
| 2017 | -22,654 | -3,850 | -2,500 | 2,158 | 8,970 | 10,628 | 6,740 | 16,105 | -2,878 | 740 | -6,718 | -14,746 |
| 2018 | -18,014 | -9,962 | -654 | 1,565 | 6,763 | 9,802 | 6,898 | 7,404 | 6,675 | 3,277 | -8,025 | -10,555 |
| 2019 | -13,333 | -1,923 | 11,829 | 11,512 | 16,297 | 14,137 | 4,769 | 8,521 | 4,365 | -6,621 | -8,820 | -11,711 |
| 2020 | -8,664 | -8,811 | 1,228 | 11,704 | 5,881 | 12,047 | 11,481 | 15,476 | 16,415 | -6,795 | -11,443 | -25,812 |
| 2021 | -24,580 | -5,828 | -1,658 | 5,935 | 3,177 | 3,498 | 7,374 | -1,349 | 3,176 | -674 | -10,794 | -17,665 |
| 2022 | -19,177 | -11,937 | 2,276 | 11,880 | 12,799 | 3,175 | 13,534 | 16,244 | 7,048 | -1,433 | -4,052 | -13,477 |
| 2023 | -16,801 | -4,112 | 3,484 | 9,136 | 11,611 | 12,695 | 6,277 | 14,515 | 9,318 | -2,213 | -11,911 | -20,131 |
| 2024 | -26,689 | -13,291 | 6,208 | 13,616 | 15,482 | 11,552 | 25,255 | 5,830 | -2,411 | -6,841 | -7,764 | -16,926 |
| 2025 | -25,761 | -12,657 | 9,569 | 14,328 | ||||||||
| - = No Data Reported; -- = Not Applicable; NA = Not Available; W = Withheld to avoid disclosure of individual company data. |
| Release Date: 6/30/2025 |
| Next Release Date: 7/31/2025 |