|
Download Data (XLS File) |
|
||||||||
|
||||||||
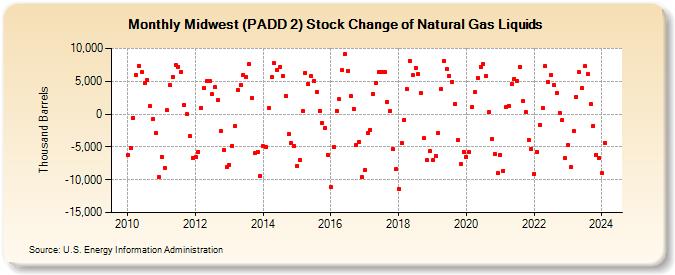
| Midwest (PADD 2) Stock Change of Natural Gas Liquids (Thousand Barrels) | ||||||||
| Year | Jan | Feb | Mar | Apr | May | Jun | Jul | Aug | Sep | Oct | Nov | Dec |
|---|---|---|---|---|---|---|---|---|---|---|---|---|
| 2010 | -6,283 | -5,171 | -543 | 5,956 | 7,387 | 6,382 | 4,753 | 5,239 | 1,174 | -825 | -2,899 | -9,552 |
| 2011 | -6,508 | -8,170 | 551 | 4,389 | 5,686 | 7,396 | 7,239 | 6,449 | 1,399 | -61 | -3,369 | -6,617 |
| 2012 | -6,575 | -5,703 | 928 | 3,957 | 4,997 | 4,982 | 2,981 | 4,057 | 2,119 | -2,513 | -5,457 | -8,123 |
| 2013 | -7,697 | -4,835 | -1,864 | 3,627 | 4,465 | 5,964 | 5,657 | 7,555 | 2,414 | -5,971 | -5,716 | -9,414 |
| 2014 | -4,935 | -4,987 | 974 | 5,608 | 7,751 | 6,759 | 7,136 | 5,859 | 2,819 | -3,070 | -4,419 | -4,874 |
| 2015 | -7,900 | -6,987 | 456 | 6,327 | 4,554 | 5,751 | 5,100 | 3,380 | 475 | -1,379 | -2,113 | -6,183 |
| 2016 | -11,150 | -5,010 | 482 | 2,247 | 6,655 | 9,102 | 6,608 | 2,689 | 772 | -4,651 | -4,238 | -9,640 |
| 2017 | -8,502 | -2,960 | -2,385 | 3,040 | 4,701 | 6,362 | 6,369 | 6,366 | 1,835 | 449 | -5,389 | -8,411 |
| 2018 | -11,440 | -4,432 | -849 | 3,812 | 8,076 | 5,878 | 7,032 | 6,075 | 3,162 | -3,659 | -7,061 | -5,642 |
| 2019 | -7,029 | -6,402 | -2,889 | 3,777 | 8,087 | 6,786 | 5,815 | 4,929 | 1,585 | -3,937 | -7,661 | -5,740 |
| 2020 | -6,572 | -5,799 | 1,068 | 3,341 | 5,552 | 7,210 | 7,695 | 5,764 | 294 | -3,726 | -6,101 | -9,039 |
| 2021 | -6,220 | -8,603 | 1,052 | 1,267 | 4,550 | 5,384 | 5,071 | 7,163 | 1,928 | 295 | -3,936 | -5,282 |
| 2022 | -9,069 | -5,798 | -1,607 | 900 | 7,251 | 4,863 | 5,961 | 4,450 | 3,217 | 235 | -937 | -6,757 |
| 2023 | -4,739 | -8,128 | -2,570 | 2,601 | 6,353 | 3,962 | 7,257 | 6,054 | 1,501 | -1,776 | -6,178 | -6,684 |
| 2024 | -9,047 | |||||||||||
| - = No Data Reported; -- = Not Applicable; NA = Not Available; W = Withheld to avoid disclosure of individual company data. |
| Release Date: 3/29/2024 |
| Next Release Date: 4/30/2024 |