|
Download Data (XLS File) |
|
||||||||
|
||||||||
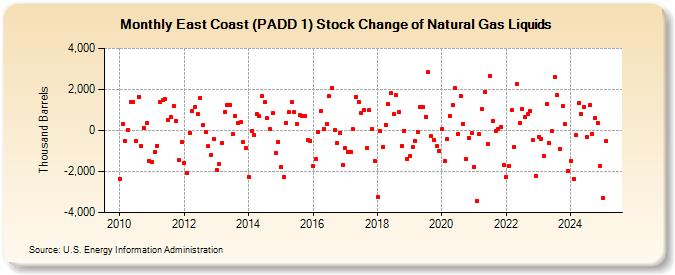
| East Coast (PADD 1) Stock Change of Natural Gas Liquids (Thousand Barrels) | ||||||||
| Year | Jan | Feb | Mar | Apr | May | Jun | Jul | Aug | Sep | Oct | Nov | Dec |
|---|---|---|---|---|---|---|---|---|---|---|---|---|
| 2010 | -2,344 | 323 | -494 | 44 | 1,399 | 1,380 | -495 | 1,647 | -750 | 120 | 374 | -1,465 |
| 2011 | -1,513 | -1,058 | -742 | 1,391 | 1,463 | 1,510 | 514 | 640 | 1,202 | 442 | -1,426 | -553 |
| 2012 | -1,578 | -2,053 | -123 | 968 | 1,134 | 792 | 1,595 | 276 | -51 | -771 | -1,191 | -414 |
| 2013 | -1,920 | -1,652 | -609 | 882 | 1,244 | 1,265 | -183 | 719 | 382 | 398 | -581 | -860 |
| 2014 | -2,249 | -39 | -221 | 800 | 695 | 1,682 | 1,386 | 588 | 54 | 835 | -1,117 | -559 |
| 2015 | -1,787 | -2,271 | 368 | 879 | 1,364 | 899 | 309 | 737 | 725 | 687 | -446 | -504 |
| 2016 | -1,753 | -1,414 | -79 | 951 | 87 | 324 | 1,666 | 2,088 | 2 | -623 | -110 | -1,691 |
| 2017 | -875 | -1,055 | -1,042 | 57 | 1,641 | 1,384 | 851 | 983 | -833 | 977 | 58 | -1,479 |
| 2018 | -3,241 | -45 | -792 | 281 | 1,284 | 1,823 | 780 | 1,727 | 913 | -744 | -6 | -1,382 |
| 2019 | -1,264 | -813 | -494 | -75 | 1,161 | 1,135 | 667 | 2,833 | -290 | -488 | -769 | -1,018 |
| 2020 | 54 | -1,493 | -436 | 727 | 1,231 | 2,066 | -187 | 1,684 | 325 | -1,379 | -343 | -147 |
| 2021 | -1,759 | -3,426 | -183 | 1,041 | 1,890 | -650 | 2,678 | 449 | -36 | 90 | 175 | -1,660 |
| 2022 | -2,257 | -1,729 | 976 | -792 | 2,274 | 352 | 1,057 | 633 | 791 | 931 | -483 | -2,241 |
| 2023 | -328 | -402 | -1,069 | 1,090 | -609 | -42 | 2,887 | 1,419 | -898 | 1,172 | 312 | -2,000 |
| 2024 | -1,502 | |||||||||||
| - = No Data Reported; -- = Not Applicable; NA = Not Available; W = Withheld to avoid disclosure of individual company data. |
| Release Date: 3/29/2024 |
| Next Release Date: 4/30/2024 |