|
Download Data (XLS File) |
|
||||||||
|
||||||||
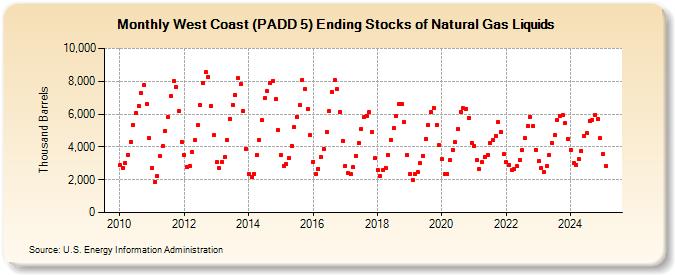
| West Coast (PADD 5) Ending Stocks of Natural Gas Liquids (Thousand Barrels) | ||||||||
| Year | Jan | Feb | Mar | Apr | May | Jun | Jul | Aug | Sep | Oct | Nov | Dec |
|---|---|---|---|---|---|---|---|---|---|---|---|---|
| 2010 | 2,879 | 2,708 | 3,020 | 3,534 | 4,316 | 5,336 | 6,058 | 6,510 | 7,305 | 7,772 | 6,623 | 4,515 |
| 2011 | 2,725 | 1,867 | 2,198 | 3,428 | 4,026 | 4,972 | 5,823 | 7,108 | 7,987 | 7,649 | 6,166 | 4,316 |
| 2012 | 3,502 | 2,748 | 2,806 | 3,692 | 4,397 | 5,308 | 6,545 | 7,922 | 8,542 | 8,280 | 6,476 | 4,708 |
| 2013 | 3,057 | 2,710 | 3,101 | 3,359 | 4,438 | 5,716 | 6,567 | 7,157 | 8,176 | 7,810 | 6,180 | 3,891 |
| 2014 | 2,369 | 2,178 | 2,369 | 3,520 | 4,420 | 5,616 | 6,974 | 7,392 | 7,877 | 8,031 | 6,909 | 5,018 |
| 2015 | 3,521 | 2,845 | 2,950 | 3,331 | 4,080 | 5,194 | 5,823 | 6,566 | 8,081 | 7,525 | 6,295 | 4,701 |
| 2016 | 3,098 | 2,346 | 2,680 | 3,359 | 3,864 | 4,903 | 6,169 | 7,358 | 8,050 | 7,509 | 6,138 | 4,387 |
| 2017 | 2,859 | 2,394 | 2,323 | 2,748 | 3,447 | 4,267 | 5,091 | 5,801 | 5,911 | 6,096 | 4,880 | 3,300 |
| 2018 | 2,586 | 2,219 | 2,580 | 2,742 | 3,536 | 4,430 | 5,139 | 5,905 | 6,608 | 6,612 | 5,522 | 3,501 |
| 2019 | 2,343 | 2,013 | 2,367 | 2,483 | 3,003 | 3,451 | 4,488 | 5,308 | 6,119 | 6,378 | 5,358 | 4,094 |
| 2020 | 3,243 | 2,320 | 2,357 | 3,199 | 3,820 | 4,282 | 5,084 | 6,154 | 6,367 | 6,323 | 5,734 | 4,240 |
| 2021 | 4,061 | 3,182 | 2,662 | 3,052 | 3,387 | 3,519 | 4,232 | 4,429 | 4,656 | 5,530 | 4,907 | 3,557 |
| 2022 | 3,061 | 2,921 | 2,577 | 2,651 | 2,817 | 3,218 | 3,823 | 4,520 | 5,276 | 5,837 | 5,282 | 3,831 |
| 2023 | 3,132 | 2,733 | 2,462 | 2,806 | 3,514 | 4,234 | 4,707 | 5,624 | 6,051 | 5,953 | 5,441 | 4,481 |
| 2024 | 3,835 | 3,027 | 2,923 | 3,248 | ||||||||
| - = No Data Reported; -- = Not Applicable; NA = Not Available; W = Withheld to avoid disclosure of individual company data. |
| Release Date: 6/28/2024 |
| Next Release Date: 7/31/2024 |