|
Download Data (XLS File) |
|
||||||||
|
||||||||
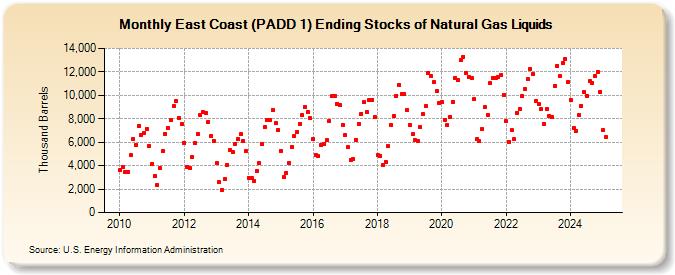
| East Coast (PADD 1) Ending Stocks of Natural Gas Liquids (Thousand Barrels) | ||||||||
| Year | Jan | Feb | Mar | Apr | May | Jun | Jul | Aug | Sep | Oct | Nov | Dec |
|---|---|---|---|---|---|---|---|---|---|---|---|---|
| 2010 | 3,599 | 3,922 | 3,428 | 3,472 | 4,871 | 6,251 | 5,756 | 7,403 | 6,653 | 6,773 | 7,147 | 5,682 |
| 2011 | 4,169 | 3,111 | 2,369 | 3,760 | 5,223 | 6,733 | 7,247 | 7,887 | 9,089 | 9,531 | 8,105 | 7,552 |
| 2012 | 5,974 | 3,921 | 3,798 | 4,766 | 5,900 | 6,692 | 8,287 | 8,563 | 8,512 | 7,741 | 6,550 | 6,136 |
| 2013 | 4,216 | 2,564 | 1,955 | 2,837 | 4,081 | 5,346 | 5,163 | 5,882 | 6,264 | 6,662 | 6,081 | 5,221 |
| 2014 | 2,972 | 2,933 | 2,712 | 3,512 | 4,207 | 5,889 | 7,275 | 7,863 | 7,917 | 8,752 | 7,635 | 7,076 |
| 2015 | 5,289 | 3,018 | 3,386 | 4,265 | 5,629 | 6,528 | 6,837 | 7,574 | 8,299 | 8,986 | 8,540 | 8,036 |
| 2016 | 6,283 | 4,869 | 4,790 | 5,741 | 5,828 | 6,152 | 7,818 | 9,906 | 9,908 | 9,285 | 9,175 | 7,484 |
| 2017 | 6,609 | 5,554 | 4,512 | 4,569 | 6,210 | 7,594 | 8,445 | 9,428 | 8,595 | 9,572 | 9,630 | 8,151 |
| 2018 | 4,910 | 4,865 | 4,073 | 4,354 | 5,638 | 7,461 | 8,241 | 9,968 | 10,881 | 10,137 | 10,131 | 8,749 |
| 2019 | 7,485 | 6,672 | 6,178 | 6,103 | 7,264 | 8,399 | 9,066 | 11,899 | 11,609 | 11,121 | 10,352 | 9,334 |
| 2020 | 9,388 | 7,895 | 7,459 | 8,186 | 9,417 | 11,483 | 11,296 | 12,980 | 13,305 | 11,926 | 11,583 | 11,436 |
| 2021 | 9,677 | 6,251 | 6,068 | 7,108 | 8,998 | 8,348 | 11,026 | 11,475 | 11,439 | 11,529 | 11,704 | 10,044 |
| 2022 | 7,787 | 6,058 | 7,034 | 6,242 | 8,516 | 8,868 | 9,924 | 10,557 | 11,348 | 12,279 | 11,796 | 9,555 |
| 2023 | 9,227 | 8,825 | 7,756 | 8,845 | 8,236 | 8,194 | 11,081 | 12,500 | 11,601 | 12,773 | 13,086 | 11,085 |
| 2024 | 9,583 | |||||||||||
| - = No Data Reported; -- = Not Applicable; NA = Not Available; W = Withheld to avoid disclosure of individual company data. |
| Release Date: 3/29/2024 |
| Next Release Date: 4/30/2024 |