|
Download Data (XLS File) |
|
||||||||
|
||||||||
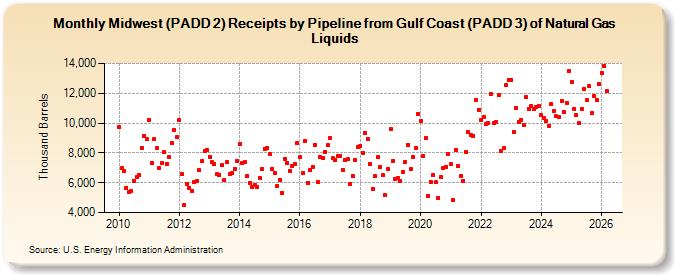
| Midwest (PADD 2) Receipts by Pipeline from Gulf Coast (PADD 3) of Natural Gas Liquids (Thousand Barrels) | ||||||||
| Year | Jan | Feb | Mar | Apr | May | Jun | Jul | Aug | Sep | Oct | Nov | Dec |
|---|---|---|---|---|---|---|---|---|---|---|---|---|
| 2010 | 9,713 | 6,970 | 6,775 | 5,663 | 5,378 | 5,456 | 6,130 | 6,407 | 6,487 | 8,339 | 9,146 | 8,903 |
| 2011 | 10,231 | 7,298 | 8,908 | 8,310 | 7,016 | 7,323 | 8,047 | 7,284 | 7,716 | 8,666 | 9,571 | 9,045 |
| 2012 | 10,183 | 6,555 | 4,496 | 5,949 | 5,674 | 5,423 | 6,048 | 6,092 | 6,826 | 7,459 | 8,102 | 8,193 |
| 2013 | 7,756 | 7,359 | 7,285 | 6,576 | 6,536 | 7,168 | 6,195 | 7,361 | 6,570 | 6,665 | 6,943 | 7,434 |
| 2014 | 8,591 | 7,331 | 7,378 | 6,431 | 6,002 | 5,688 | 5,873 | 5,702 | 6,303 | 6,955 | 8,291 | 8,332 |
| 2015 | 7,932 | 6,931 | 6,632 | 5,786 | 6,217 | 5,340 | 7,625 | 7,325 | 6,800 | 7,123 | 7,253 | 8,664 |
| 2016 | 7,714 | 6,680 | 8,769 | 6,013 | 6,879 | 7,054 | 8,564 | 6,056 | 7,718 | 7,647 | 8,046 | 8,534 |
| 2017 | 9,018 | 7,644 | 7,556 | 7,823 | 7,810 | 6,873 | 7,535 | 7,572 | 5,948 | 6,467 | 7,511 | 8,429 |
| 2018 | 8,488 | 8,027 | 9,363 | 8,953 | 7,249 | 5,601 | 6,436 | 7,737 | 7,088 | 6,489 | 5,159 | 6,903 |
| 2019 | 9,597 | 7,491 | 6,253 | 6,296 | 6,107 | 6,720 | 7,418 | 8,518 | 6,916 | 7,755 | 8,335 | 10,602 |
| 2020 | 10,172 | 7,808 | 9,024 | 5,143 | 6,080 | 6,519 | 6,034 | 4,973 | 6,373 | 6,966 | 7,073 | 7,900 |
| 2021 | 7,290 | 4,817 | 8,209 | 7,122 | 6,461 | 6,101 | 8,094 | 9,374 | 9,196 | 9,136 | 11,526 | 10,901 |
| 2022 | 10,198 | 10,385 | 9,954 | 9,984 | 11,960 | 9,987 | 10,061 | 11,870 | 8,147 | 8,327 | 12,531 | 12,921 |
| 2023 | 12,923 | 9,380 | 11,038 | 10,093 | 10,232 | 9,895 | 11,750 | 10,975 | 11,118 | 10,964 | 11,098 | 11,139 |
| 2024 | 10,514 | |||||||||||
| - = No Data Reported; -- = Not Applicable; NA = Not Available; W = Withheld to avoid disclosure of individual company data. |
| Release Date: 3/29/2024 |
| Next Release Date: 4/30/2024 |