|
Download Data (XLS File) |
|
||||||||
|
||||||||
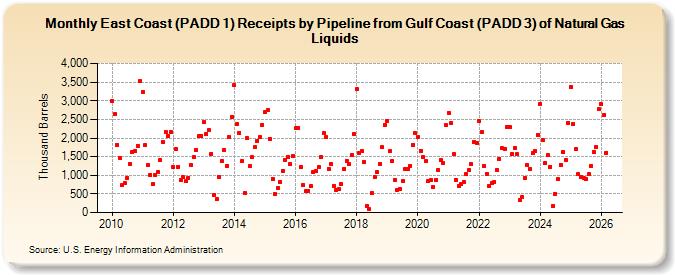
| East Coast (PADD 1) Receipts by Pipeline from Gulf Coast (PADD 3) of Natural Gas Liquids (Thousand Barrels) | ||||||||
| Year | Jan | Feb | Mar | Apr | May | Jun | Jul | Aug | Sep | Oct | Nov | Dec |
|---|---|---|---|---|---|---|---|---|---|---|---|---|
| 2010 | 3,004 | 2,636 | 1,820 | 1,476 | 731 | 795 | 937 | 1,314 | 1,631 | 1,650 | 1,793 | 3,528 |
| 2011 | 3,234 | 1,803 | 1,265 | 1,011 | 771 | 1,001 | 1,088 | 1,404 | 1,897 | 2,162 | 2,051 | 2,163 |
| 2012 | 1,221 | 1,696 | 1,234 | 874 | 946 | 838 | 937 | 1,276 | 1,483 | 1,686 | 2,043 | 2,060 |
| 2013 | 2,423 | 2,105 | 2,203 | 1,580 | 481 | 353 | 960 | 1,388 | 1,680 | 1,259 | 2,022 | 2,564 |
| 2014 | 3,420 | 2,381 | 2,145 | 1,375 | 526 | 1,992 | 1,243 | 1,483 | 1,750 | 1,930 | 2,016 | 2,352 |
| 2015 | 2,704 | 2,742 | 1,982 | 907 | 495 | 665 | 829 | 1,124 | 1,411 | 1,488 | 1,300 | 1,517 |
| 2016 | 2,261 | 2,269 | 1,221 | 749 | 578 | 583 | 712 | 1,081 | 1,114 | 1,216 | 1,489 | 2,131 |
| 2017 | 2,022 | 1,181 | 1,307 | 723 | 616 | 640 | 770 | 1,181 | 1,385 | 1,297 | 1,533 | 2,113 |
| 2018 | 3,317 | 1,611 | 1,645 | 1,365 | 173 | 94 | 531 | 962 | 1,083 | 1,305 | 1,751 | 2,361 |
| 2019 | 2,468 | 1,640 | 1,380 | 875 | 617 | 641 | 836 | 1,171 | 1,162 | 1,257 | 1,817 | 2,122 |
| 2020 | 2,029 | 1,652 | 1,483 | 1,373 | 836 | 865 | 698 | 863 | 1,148 | 1,398 | 1,329 | 2,337 |
| 2021 | 2,680 | 2,404 | 1,560 | 887 | 719 | 756 | 820 | 1,023 | 1,141 | 1,299 | 1,904 | 1,878 |
| 2022 | 2,455 | 2,158 | 1,255 | 1,045 | 723 | 784 | 820 | 1,148 | 1,450 | 1,725 | 1,703 | 2,299 |
| 2023 | 2,298 | 1,573 | 1,742 | 1,561 | 341 | 407 | 936 | 1,264 | 1,174 | 1,595 | 1,653 | 2,085 |
| 2024 | 2,922 | |||||||||||
| - = No Data Reported; -- = Not Applicable; NA = Not Available; W = Withheld to avoid disclosure of individual company data. |
| Release Date: 3/29/2024 |
| Next Release Date: 4/30/2024 |