|
Download Data (XLS File) |
|
||||||||
|
||||||||
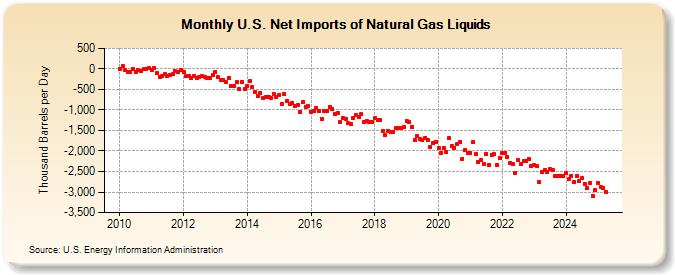
| U.S. Net Imports of Natural Gas Liquids (Thousand Barrels per Day) | ||||||||
| Year | Jan | Feb | Mar | Apr | May | Jun | Jul | Aug | Sep | Oct | Nov | Dec |
|---|---|---|---|---|---|---|---|---|---|---|---|---|
| 2010 | -2 | 62 | -29 | -82 | -75 | -9 | -67 | -38 | -41 | -3 | -4 | 15 |
| 2011 | -33 | 26 | -108 | -193 | -184 | -133 | -163 | -146 | -133 | -58 | -70 | -17 |
| 2012 | -81 | -167 | -169 | -216 | -174 | -231 | -192 | -170 | -196 | -211 | -232 | -154 |
| 2013 | -65 | -196 | -260 | -269 | -331 | -226 | -420 | -413 | -322 | -482 | -314 | -481 |
| 2014 | -413 | -304 | -445 | -558 | -651 | -585 | -705 | -674 | -681 | -705 | -600 | -678 |
| 2015 | -636 | -849 | -610 | -781 | -859 | -822 | -902 | -877 | -1,041 | -809 | -920 | -909 |
| 2016 | -1,048 | -1,021 | -953 | -1,033 | -1,218 | -1,024 | -1,030 | -926 | -978 | -1,087 | -1,072 | -1,282 |
| 2017 | -1,199 | -1,214 | -1,325 | -1,352 | -1,205 | -1,125 | -1,163 | -1,102 | -1,299 | -1,271 | -1,298 | -1,305 |
| 2018 | -1,204 | -1,234 | -1,243 | -1,518 | -1,619 | -1,511 | -1,528 | -1,527 | -1,431 | -1,438 | -1,448 | -1,424 |
| 2019 | -1,281 | -1,291 | -1,415 | -1,738 | -1,646 | -1,714 | -1,734 | -1,676 | -1,735 | -1,902 | -1,808 | -1,773 |
| 2020 | -1,930 | -2,049 | -1,924 | -2,026 | -1,686 | -1,874 | -1,919 | -1,838 | -1,778 | -2,187 | -1,982 | -2,054 |
| 2021 | -2,045 | -1,782 | -2,064 | -2,270 | -2,231 | -2,311 | -2,068 | -2,338 | -2,095 | -2,082 | -2,336 | -2,182 |
| 2022 | -2,057 | -2,043 | -2,151 | -2,286 | -2,328 | -2,531 | -2,217 | -2,329 | -2,244 | -2,236 | -2,194 | -2,377 |
| 2023 | -2,355 | -2,435 | -2,657 | -2,499 | -2,303 | -2,416 | -2,386 | -2,387 | -2,553 | -2,522 | -2,639 | -2,628 |
| 2024 | -2,535 | |||||||||||
| - = No Data Reported; -- = Not Applicable; NA = Not Available; W = Withheld to avoid disclosure of individual company data. |
| Release Date: 3/29/2024 |
| Next Release Date: 4/30/2024 |