|
Download Data (XLS File) |
|
||||||||
|
||||||||
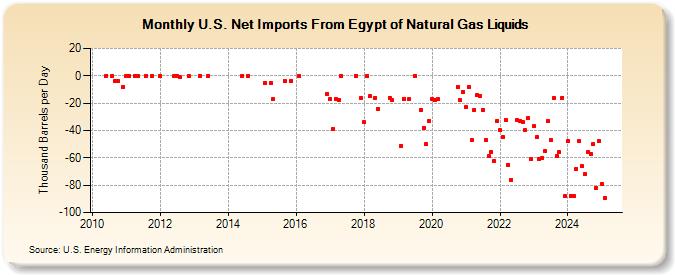
| U.S. Net Imports From Egypt of Natural Gas Liquids (Thousand Barrels per Day) | ||||||||
| Year | Jan | Feb | Mar | Apr | May | Jun | Jul | Aug | Sep | Oct | Nov | Dec |
|---|---|---|---|---|---|---|---|---|---|---|---|---|
| 2010 | 0 | 0 | -4 | -4 | -8 | |||||||
| 2011 | 0 | 0 | 0 | 0 | 0 | 0 | ||||||
| 2012 | 0 | 0 | 0 | -1 | 0 | |||||||
| 2013 | 0 | 0 | ||||||||||
| 2014 | 0 | 0 | ||||||||||
| 2015 | -5 | -5 | -17 | -4 | -4 | |||||||
| 2016 | 0 | -13 | ||||||||||
| 2017 | -17 | -39 | -17 | -18 | 0 | 0 | -16 | |||||
| 2018 | -34 | 0 | -15 | -16 | -24 | -16 | -18 | |||||
| 2019 | -51 | -17 | -17 | 0 | -25 | -38 | -50 | -33 | ||||
| 2020 | -17 | -18 | -17 | -8 | -18 | -12 | ||||||
| 2021 | -23 | -8 | -47 | -25 | -14 | -15 | -25 | -47 | -59 | -56 | -62 | -33 |
| 2022 | -40 | -45 | -32 | -65 | -76 | -32 | -33 | -34 | -40 | -31 | -61 | |
| 2023 | -37 | -45 | -61 | -60 | -55 | -33 | -47 | -16 | -59 | -56 | -16 | -88 |
| 2024 | -48 | -88 | -88 | -68 | -48 | -66 | ||||||
| - = No Data Reported; -- = Not Applicable; NA = Not Available; W = Withheld to avoid disclosure of individual company data. |
| Release Date: 8/30/2024 |
| Next Release Date: 9/30/2024 |