|
Download Data (XLS File) |
|
||||||||
|
||||||||
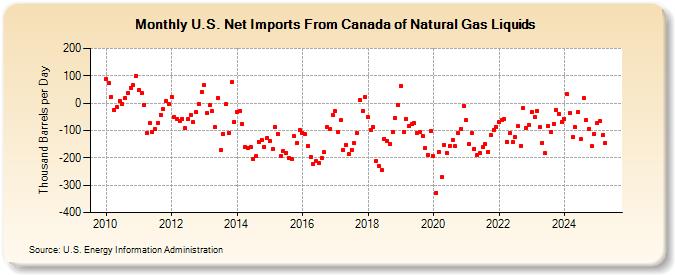
| U.S. Net Imports From Canada of Natural Gas Liquids (Thousand Barrels per Day) | ||||||||
| Year | Jan | Feb | Mar | Apr | May | Jun | Jul | Aug | Sep | Oct | Nov | Dec |
|---|---|---|---|---|---|---|---|---|---|---|---|---|
| 2010 | 88 | 74 | 23 | -26 | -15 | 9 | -2 | 18 | 38 | 57 | 65 | 100 |
| 2011 | 48 | 38 | -6 | -111 | -74 | -106 | -96 | -71 | -42 | -23 | 7 | -3 |
| 2012 | 24 | -51 | -57 | -66 | -57 | -91 | -58 | -42 | -70 | -32 | -2 | 41 |
| 2013 | 65 | -37 | -8 | -30 | -88 | 19 | -173 | -112 | -5 | -109 | 77 | -68 |
| 2014 | -31 | -28 | -75 | -159 | -163 | -159 | -203 | -195 | -141 | -133 | -160 | -126 |
| 2015 | -138 | -168 | -87 | -112 | -195 | -175 | -181 | -200 | -206 | -122 | -146 | -100 |
| 2016 | -109 | -114 | -156 | -198 | -221 | -213 | -220 | -200 | -180 | -89 | -94 | -43 |
| 2017 | -29 | -104 | -63 | -173 | -152 | -187 | -170 | -146 | -111 | 13 | -28 | 23 |
| 2018 | -51 | -97 | -86 | -211 | -229 | -245 | -130 | -139 | -149 | -106 | -55 | -7 |
| 2019 | 63 | -105 | -57 | -85 | -77 | -73 | -108 | -106 | -120 | -165 | -190 | -103 |
| 2020 | -195 | -327 | -177 | -271 | -152 | -183 | -155 | -133 | -158 | -109 | -93 | -10 |
| 2021 | -63 | -150 | -109 | -167 | -190 | -183 | -162 | -149 | -177 | -117 | -98 | -86 |
| 2022 | -68 | -61 | -59 | -141 | -111 | -143 | -125 | -85 | -156 | -17 | -90 | -80 |
| 2023 | -28 | -38 | -24 | -95 | -23 | -74 | -18 | -13 | 5 | 54 | -37 | -64 |
| 2024 | -58 | 33 | -36 | -123 | ||||||||
| - = No Data Reported; -- = Not Applicable; NA = Not Available; W = Withheld to avoid disclosure of individual company data. |
| Release Date: 6/28/2024 |
| Next Release Date: 7/31/2024 |