|
Download Data (XLS File) |
|
||||||||
|
||||||||
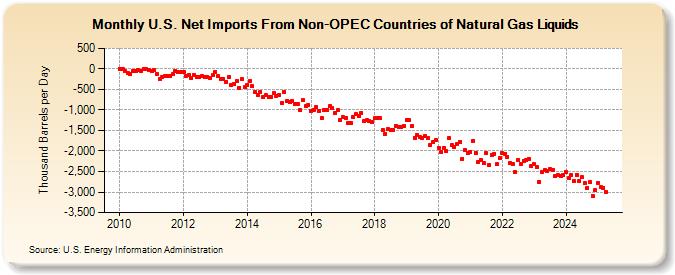
| U.S. Net Imports From Non-OPEC Countries of Natural Gas Liquids (Thousand Barrels per Day) | ||||||||
| Year | Jan | Feb | Mar | Apr | May | Jun | Jul | Aug | Sep | Oct | Nov | Dec |
|---|---|---|---|---|---|---|---|---|---|---|---|---|
| 2010 | 6 | -9 | -45 | -99 | -112 | -39 | -55 | -25 | -41 | 8 | -10 | -29 |
| 2011 | -51 | -26 | -127 | -252 | -202 | -184 | -168 | -162 | -130 | -40 | -75 | -75 |
| 2012 | -69 | -178 | -151 | -229 | -154 | -199 | -205 | -184 | -206 | -196 | -210 | -154 |
| 2013 | -65 | -183 | -244 | -246 | -309 | -202 | -386 | -372 | -293 | -463 | -257 | -449 |
| 2014 | -385 | -290 | -422 | -562 | -627 | -562 | -688 | -647 | -685 | -678 | -596 | -666 |
| 2015 | -628 | -828 | -567 | -781 | -801 | -781 | -845 | -851 | -1,003 | -760 | -908 | -877 |
| 2016 | -1,014 | -990 | -930 | -1,014 | -1,200 | -993 | -1,000 | -912 | -958 | -1,069 | -1,007 | -1,249 |
| 2017 | -1,177 | -1,192 | -1,325 | -1,322 | -1,179 | -1,105 | -1,151 | -1,073 | -1,268 | -1,255 | -1,280 | -1,292 |
| 2018 | -1,201 | -1,200 | -1,198 | -1,479 | -1,575 | -1,468 | -1,495 | -1,488 | -1,381 | -1,421 | -1,411 | -1,388 |
| 2019 | -1,239 | -1,254 | -1,380 | -1,675 | -1,614 | -1,660 | -1,673 | -1,637 | -1,693 | -1,853 | -1,770 | -1,736 |
| 2020 | -1,927 | -2,036 | -1,917 | -2,008 | -1,684 | -1,848 | -1,904 | -1,827 | -1,771 | -2,188 | -1,976 | -2,048 |
| 2021 | -2,016 | -1,745 | -2,038 | -2,257 | -2,216 | -2,300 | -2,046 | -2,330 | -2,088 | -2,067 | -2,319 | -2,177 |
| 2022 | -2,046 | -2,061 | -2,142 | -2,284 | -2,321 | -2,512 | -2,211 | -2,306 | -2,237 | -2,228 | -2,187 | -2,369 |
| 2023 | -2,341 | -2,438 | -2,647 | -2,494 | -2,296 | -2,405 | -2,371 | -2,372 | -2,556 | -2,500 | -2,625 | -2,626 |
| 2024 | -2,511 | |||||||||||
| - = No Data Reported; -- = Not Applicable; NA = Not Available; W = Withheld to avoid disclosure of individual company data. |
| Release Date: 3/29/2024 |
| Next Release Date: 4/30/2024 |