|
Download Data (XLS File) |
|
||||||||
|
||||||||
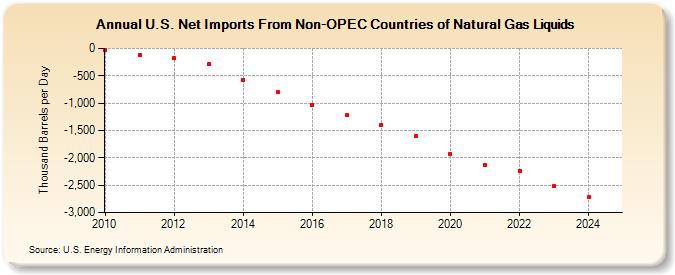
| U.S. Net Imports From Non-OPEC Countries of Natural Gas Liquids (Thousand Barrels per Day) | ||||||||
| Decade | Year-0 | Year-1 | Year-2 | Year-3 | Year-4 | Year-5 | Year-6 | Year-7 | Year-8 | Year-9 |
|---|---|---|---|---|---|---|---|---|---|---|
| 2010's | -38 | -125 | -177 | -290 | -569 | -802 | -1,029 | -1,218 | -1,393 | -1,600 |
| 2020's | -1,928 | -2,135 | -2,243 | -2,472 |
| - = No Data Reported; -- = Not Applicable; NA = Not Available; W = Withheld to avoid disclosure of individual company data. |
| Release Date: 3/29/2024 |
| Next Release Date: 8/30/2024 |