|
Download Data (XLS File) |
|
||||||||
|
||||||||
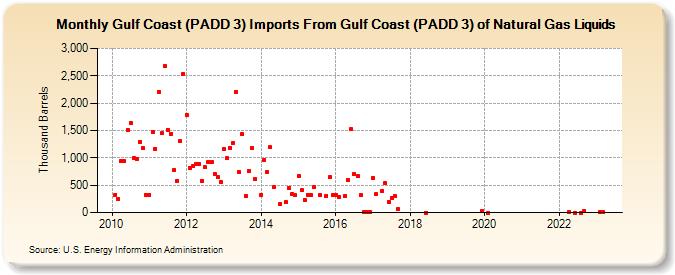
| Gulf Coast (PADD 3) Imports From Gulf Coast (PADD 3) of Natural Gas Liquids (Thousand Barrels) | ||||||||
| Year | Jan | Feb | Mar | Apr | May | Jun | Jul | Aug | Sep | Oct | Nov | Dec |
|---|---|---|---|---|---|---|---|---|---|---|---|---|
| 2010 | 330 | 249 | 951 | 940 | 1,505 | 1,642 | 999 | 978 | 1,298 | 1,171 | 322 | |
| 2011 | 326 | 1,469 | 1,170 | 2,209 | 1,448 | 2,672 | 1,517 | 1,438 | 782 | 578 | 1,300 | 2,533 |
| 2012 | 1,782 | 817 | 846 | 895 | 893 | 585 | 829 | 927 | 921 | 711 | 643 | 554 |
| 2013 | 1,155 | 990 | 1,187 | 1,279 | 2,210 | 737 | 1,432 | 306 | 766 | 1,187 | 621 | |
| 2014 | 323 | 957 | 745 | 1,193 | 462 | 150 | 185 | 451 | 348 | 320 | ||
| 2015 | 670 | 412 | 227 | 329 | 319 | 460 | 320 | 309 | 641 | 315 | ||
| 2016 | 330 | 287 | 300 | 600 | 1,522 | 700 | 668 | 312 | 3 | 5 | 8 | |
| 2017 | 640 | 334 | 396 | 533 | 199 | 270 | 301 | 60 | ||||
| 2018 | 1 | |||||||||||
| 2019 | 30 | |||||||||||
| 2020 | 0 | |||||||||||
| 2022 | 16 | 1 | 1 | 30 | ||||||||
| 2023 | 3 | 6 | ||||||||||
| - = No Data Reported; -- = Not Applicable; NA = Not Available; W = Withheld to avoid disclosure of individual company data. |
| Release Date: 8/30/2024 |
| Next Release Date: 9/30/2024 |