|
Download Data (XLS File) |
|
||||||||
|
||||||||
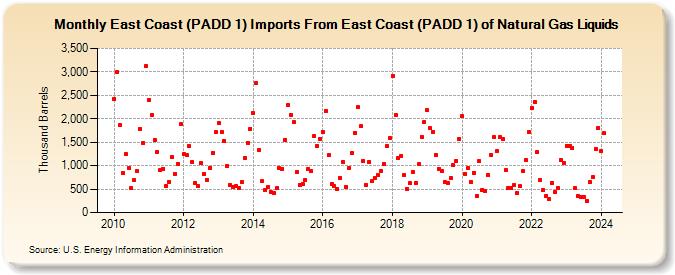
| East Coast (PADD 1) Imports From East Coast (PADD 1) of Natural Gas Liquids (Thousand Barrels) | ||||||||
| Year | Jan | Feb | Mar | Apr | May | Jun | Jul | Aug | Sep | Oct | Nov | Dec |
|---|---|---|---|---|---|---|---|---|---|---|---|---|
| 2010 | 2,426 | 3,000 | 1,859 | 850 | 1,244 | 952 | 517 | 687 | 879 | 1,789 | 1,484 | 3,121 |
| 2011 | 2,405 | 2,082 | 1,545 | 1,298 | 910 | 932 | 570 | 662 | 1,184 | 829 | 1,041 | 1,878 |
| 2012 | 1,246 | 1,223 | 1,412 | 1,080 | 638 | 566 | 1,054 | 818 | 697 | 956 | 1,277 | 1,711 |
| 2013 | 1,914 | 1,722 | 1,535 | 997 | 591 | 540 | 566 | 525 | 647 | 1,161 | 1,492 | 1,789 |
| 2014 | 2,116 | 2,755 | 1,328 | 666 | 471 | 546 | 448 | 427 | 517 | 950 | 930 | 1,550 |
| 2015 | 2,297 | 2,088 | 1,923 | 864 | 597 | 615 | 698 | 929 | 878 | 1,628 | 1,421 | 1,577 |
| 2016 | 1,723 | 2,174 | 1,226 | 612 | 562 | 497 | 735 | 1,082 | 550 | 949 | 1,267 | 1,702 |
| 2017 | 2,246 | 1,835 | 1,101 | 588 | 1,079 | 681 | 744 | 796 | 893 | 1,041 | 1,410 | 1,588 |
| 2018 | 2,922 | 2,090 | 1,165 | 1,200 | 792 | 508 | 623 | 855 | 634 | 1,029 | 1,620 | 1,926 |
| 2019 | 2,181 | 1,797 | 1,718 | 1,231 | 934 | 891 | 656 | 635 | 735 | 1,013 | 1,104 | 1,571 |
| 2020 | 2,058 | 831 | 945 | 656 | 851 | 355 | 1,098 | 490 | 451 | 797 | 1,233 | 1,605 |
| 2021 | 1,309 | 1,605 | 1,571 | 906 | 522 | 521 | 587 | 413 | 560 | 881 | 1,119 | 1,715 |
| 2022 | 2,232 | 2,358 | 1,287 | 703 | 472 | 343 | 283 | 632 | 437 | 530 | 1,128 | 1,062 |
| 2023 | 1,427 | 1,422 | 1,382 | 514 | 360 | 334 | 341 | 254 | 655 | 756 | 1,357 | 1,804 |
| 2024 | 1,302 | |||||||||||
| - = No Data Reported; -- = Not Applicable; NA = Not Available; W = Withheld to avoid disclosure of individual company data. |
| Release Date: 3/29/2024 |
| Next Release Date: 4/30/2024 |