|
Download Data (XLS File) |
|
||||||||
|
||||||||
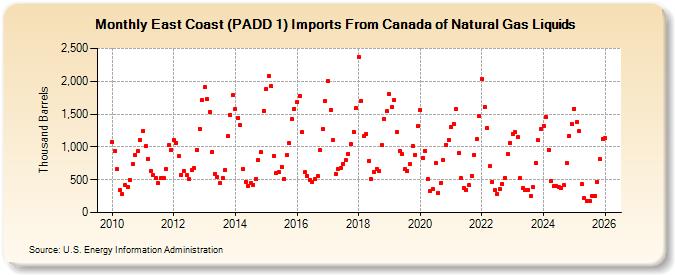
| East Coast (PADD 1) Imports From Canada of Natural Gas Liquids (Thousand Barrels) | ||||||||
| Year | Jan | Feb | Mar | Apr | May | Jun | Jul | Aug | Sep | Oct | Nov | Dec |
|---|---|---|---|---|---|---|---|---|---|---|---|---|
| 2010 | 1,077 | 934 | 659 | 339 | 285 | 414 | 389 | 500 | 737 | 874 | 934 | 1,108 |
| 2011 | 1,243 | 1,011 | 819 | 634 | 570 | 528 | 444 | 523 | 522 | 656 | 1,022 | 955 |
| 2012 | 1,107 | 1,059 | 855 | 576 | 638 | 566 | 506 | 644 | 675 | 956 | 1,277 | 1,711 |
| 2013 | 1,914 | 1,722 | 1,535 | 924 | 591 | 540 | 453 | 525 | 647 | 1,160 | 1,492 | 1,789 |
| 2014 | 1,579 | 1,444 | 1,328 | 666 | 470 | 411 | 448 | 427 | 516 | 804 | 917 | 1,550 |
| 2015 | 1,878 | 2,087 | 1,921 | 864 | 597 | 614 | 698 | 518 | 878 | 1,054 | 1,421 | 1,577 |
| 2016 | 1,680 | 1,775 | 1,226 | 612 | 562 | 497 | 466 | 505 | 550 | 949 | 1,267 | 1,702 |
| 2017 | 2,009 | 1,561 | 1,101 | 588 | 660 | 681 | 744 | 796 | 893 | 1,041 | 1,233 | 1,588 |
| 2018 | 2,371 | 1,698 | 1,165 | 1,200 | 792 | 508 | 623 | 663 | 634 | 1,029 | 1,428 | 1,542 |
| 2019 | 1,798 | 1,605 | 1,718 | 1,231 | 934 | 891 | 656 | 635 | 735 | 1,013 | 880 | 1,312 |
| 2020 | 1,565 | 831 | 945 | 505 | 322 | 355 | 757 | 304 | 451 | 797 | 1,035 | 1,107 |
| 2021 | 1,309 | 1,352 | 1,571 | 906 | 522 | 377 | 342 | 413 | 560 | 881 | 1,119 | 1,472 |
| 2022 | 2,036 | 1,612 | 1,287 | 703 | 472 | 343 | 283 | 363 | 437 | 529 | 891 | 1,060 |
| 2023 | 1,170 | 1,177 | 1,125 | 514 | 360 | 334 | 341 | 254 | 386 | 756 | 1,100 | 1,278 |
| 2024 | 1,302 | |||||||||||
| - = No Data Reported; -- = Not Applicable; NA = Not Available; W = Withheld to avoid disclosure of individual company data. |
| Release Date: 3/29/2024 |
| Next Release Date: 4/30/2024 |