|
Download Data (XLS File) |
|
||||||||
|
||||||||
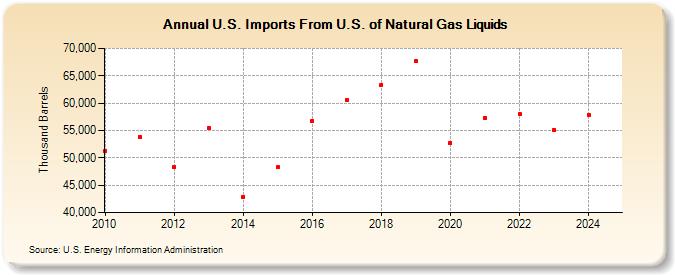
| U.S. Imports From U.S. of Natural Gas Liquids (Thousand Barrels) | ||||||||
| Decade | Year-0 | Year-1 | Year-2 | Year-3 | Year-4 | Year-5 | Year-6 | Year-7 | Year-8 | Year-9 |
|---|---|---|---|---|---|---|---|---|---|---|
| 2010's | 51,302 | 53,870 | 48,328 | 55,483 | 42,928 | 48,265 | 56,714 | 60,585 | 63,363 | 67,655 |
| 2020's | 52,724 | 57,246 | 58,054 | 55,095 |
| - = No Data Reported; -- = Not Applicable; NA = Not Available; W = Withheld to avoid disclosure of individual company data. |
| Release Date: 8/30/2024 |
| Next Release Date: 8/29/2025 |