|
Download Data (XLS File) |
|
||||||||
|
||||||||
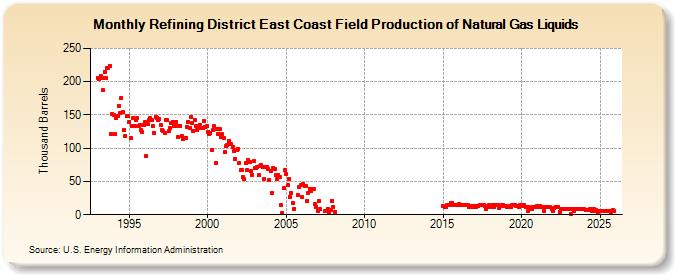
| Refining District East Coast Field Production of Natural Gas Liquids (Thousand Barrels) | ||||||||
| Year | Jan | Feb | Mar | Apr | May | Jun | Jul | Aug | Sep | Oct | Nov | Dec |
|---|---|---|---|---|---|---|---|---|---|---|---|---|
| 1993 | 206 | 204 | 209 | 206 | 187 | 215 | 206 | 221 | 221 | 224 | 122 | 151 |
| 1994 | 150 | 121 | 145 | 148 | 164 | 153 | 176 | 154 | 128 | 119 | 149 | 149 |
| 1995 | 140 | 116 | 134 | 145 | 134 | 142 | 146 | 133 | 135 | 127 | 124 | 135 |
| 1996 | 139 | 89 | 137 | 143 | 145 | 142 | 134 | 123 | 147 | 145 | 142 | 144 |
| 1997 | 135 | 127 | 126 | 123 | 143 | 142 | 126 | 130 | 138 | 139 | 133 | 134 |
| 1998 | 140 | 117 | 134 | 133 | 118 | 114 | 115 | 115 | 132 | 140 | 131 | 147 |
| 1999 | 138 | 126 | 143 | 133 | 128 | 132 | 135 | 131 | 130 | 141 | 132 | 133 |
| 2000 | 125 | 121 | 123 | 98 | 128 | 133 | 77 | 129 | 122 | 129 | 117 | 121 |
| 2001 | 116 | 95 | 103 | 105 | 111 | 106 | 106 | 102 | 96 | 84 | 97 | 99 |
| 2002 | 78 | 67 | 67 | 56 | 54 | 78 | 67 | 82 | 79 | 65 | 60 | 80 |
| 2003 | 70 | 70 | 72 | 60 | 73 | 74 | 71 | 53 | 71 | 71 | 69 | 52 |
| 2004 | 65 | 32 | 70 | 68 | 59 | 54 | 59 | 56 | 14 | 3 | 40 | 67 |
| 2005 | 61 | 44 | 53 | 26 | 32 | 18 | 9 | 30 | 42 | 44 | ||
| 2006 | 27 | 46 | 43 | 43 | 21 | 33 | 39 | 36 | 39 | 39 | 16 | 12 |
| 2007 | 6 | 21 | 8 | 6 | 6 | 9 | 4 | 7 | 21 | |||
| 2008 | 12 | 4 | ||||||||||
| 2015 | 13 | 12 | 11 | 14 | 14 | 15 | 18 | 18 | 15 | 15 | 15 | 15 |
| 2016 | 16 | 14 | 15 | 14 | 14 | 14 | 14 | 14 | 12 | 13 | 13 | 12 |
| 2017 | 13 | 11 | 13 | 13 | 14 | 15 | 15 | 14 | 13 | 8 | 11 | 14 |
| 2018 | 12 | 13 | 14 | 11 | 14 | 14 | 15 | 10 | 13 | 14 | 14 | 13 |
| 2019 | 13 | 12 | 12 | 13 | 12 | 14 | 14 | 14 | 13 | 13 | 12 | 14 |
| 2020 | 14 | 13 | 14 | 11 | 5 | 11 | 9 | 9 | 11 | 11 | 11 | |
| 2021 | 13 | 11 | 13 | 12 | 11 | 6 | 11 | 11 | 11 | 11 | 11 | 9 |
| 2022 | 5 | 10 | 12 | 12 | 12 | 4 | 9 | 9 | 8 | 9 | 9 | 9 |
| 2023 | 9 | 8 | 1 | 8 | 5 | 8 | 8 | 9 | 8 | 8 | 9 | 9 |
| 2024 | 8 | 7 | 7 | 7 | ||||||||
| - = No Data Reported; -- = Not Applicable; NA = Not Available; W = Withheld to avoid disclosure of individual company data. |
| Release Date: 6/28/2024 |
| Next Release Date: 7/31/2024 |