|
Download Data (XLS File) |
|
||||||||
|
||||||||
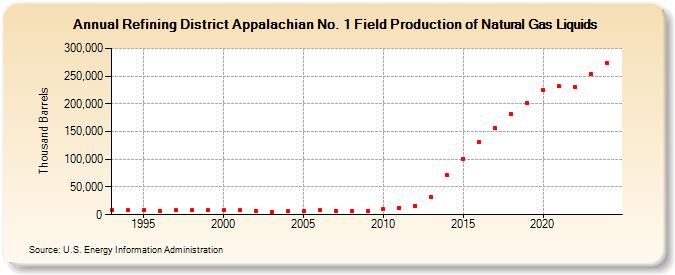
| Refining District Appalachian No. 1 Field Production of Natural Gas Liquids (Thousand Barrels) | ||||||||
| Decade | Year-0 | Year-1 | Year-2 | Year-3 | Year-4 | Year-5 | Year-6 | Year-7 | Year-8 | Year-9 |
|---|---|---|---|---|---|---|---|---|---|---|
| 1990's | 7,699 | 7,765 | 7,877 | 6,048 | 7,850 | 8,028 | 7,793 | |||
| 2000's | 8,024 | 8,201 | 7,454 | 5,594 | 5,923 | 5,914 | 7,625 | 7,224 | 6,735 | 7,365 |
| 2010's | 9,692 | 12,991 | 16,548 | 31,631 | 70,807 | 101,226 | 131,873 | 155,802 | 181,361 | 201,150 |
| 2020's | 224,385 | 231,699 | 231,003 | 253,892 |
| - = No Data Reported; -- = Not Applicable; NA = Not Available; W = Withheld to avoid disclosure of individual company data. |
| Release Date: 3/29/2024 |
| Next Release Date: 8/30/2024 |