|
Download Data (XLS File) |
|
||||||||
|
||||||||
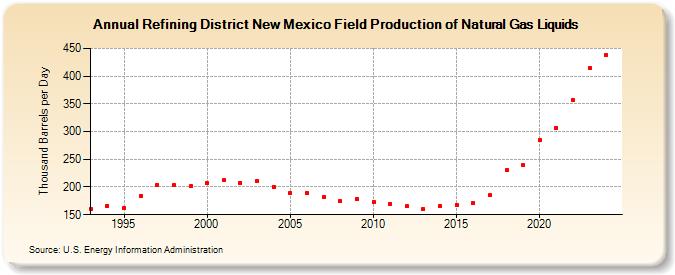
| Refining District New Mexico Field Production of Natural Gas Liquids (Thousand Barrels per Day) | ||||||||
| Decade | Year-0 | Year-1 | Year-2 | Year-3 | Year-4 | Year-5 | Year-6 | Year-7 | Year-8 | Year-9 |
|---|---|---|---|---|---|---|---|---|---|---|
| 1990's | 161 | 166 | 162 | 184 | 204 | 203 | 201 | |||
| 2000's | 207 | 212 | 208 | 210 | 200 | 189 | 189 | 182 | 174 | 178 |
| 2010's | 173 | 170 | 165 | 160 | 165 | 168 | 171 | 185 | 230 | 239 |
| 2020's | 284 | 307 | 357 | 418 |
| - = No Data Reported; -- = Not Applicable; NA = Not Available; W = Withheld to avoid disclosure of individual company data. |
| Release Date: 3/29/2024 |
| Next Release Date: 8/30/2024 |