|
Download Data (XLS File) |
|
||||||||
|
||||||||
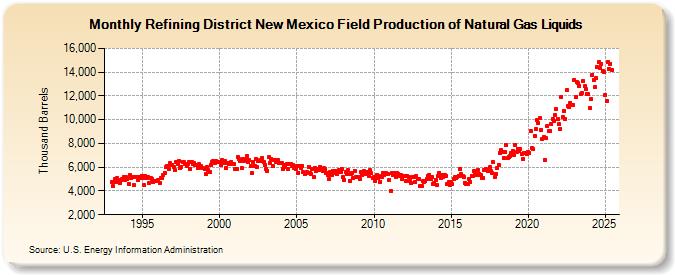
| Refining District New Mexico Field Production of Natural Gas Liquids (Thousand Barrels) | ||||||||
| Year | Jan | Feb | Mar | Apr | May | Jun | Jul | Aug | Sep | Oct | Nov | Dec |
|---|---|---|---|---|---|---|---|---|---|---|---|---|
| 1993 | 4,762 | 4,376 | 4,979 | 4,734 | 5,051 | 4,823 | 4,667 | 4,936 | 4,994 | 5,205 | 4,961 | 5,140 |
| 1994 | 5,039 | 4,589 | 5,334 | 5,093 | 5,160 | 4,488 | 5,149 | 5,177 | 4,913 | 5,194 | 5,073 | 5,259 |
| 1995 | 5,089 | 4,492 | 5,241 | 5,064 | 5,160 | 4,676 | 5,099 | 5,026 | 4,755 | 4,845 | 4,859 | 4,825 |
| 1996 | 4,923 | 4,631 | 5,087 | 5,056 | 5,349 | 5,529 | 5,992 | 6,115 | 5,826 | 6,312 | 6,180 | 6,197 |
| 1997 | 5,999 | 5,727 | 6,400 | 6,238 | 6,492 | 5,962 | 6,052 | 6,416 | 6,422 | 6,307 | 6,131 | 6,265 |
| 1998 | 6,414 | 5,850 | 6,447 | 6,300 | 6,350 | 6,223 | 6,162 | 5,965 | 6,245 | 6,070 | 5,966 | 5,928 |
| 1999 | 5,864 | 5,443 | 5,976 | 5,733 | 5,584 | 6,219 | 6,479 | 6,521 | 6,355 | 6,490 | 6,401 | 6,415 |
| 2000 | 6,460 | 6,151 | 6,590 | 6,337 | 6,515 | 5,926 | 6,341 | 6,243 | 6,269 | 6,452 | 6,290 | 6,248 |
| 2001 | 5,823 | 5,849 | 6,872 | 6,656 | 6,524 | 5,927 | 6,709 | 6,561 | 6,646 | 6,948 | 6,457 | 6,568 |
| 2002 | 6,106 | 5,528 | 6,475 | 6,101 | 6,685 | 5,994 | 6,558 | 6,564 | 6,525 | 6,814 | 6,457 | 6,211 |
| 2003 | 5,887 | 5,681 | 6,833 | 6,385 | 6,720 | 6,067 | 6,637 | 6,631 | 6,396 | 6,603 | 6,347 | 6,382 |
| 2004 | 6,367 | 5,857 | 6,224 | 5,999 | 6,272 | 5,809 | 6,304 | 6,271 | 6,101 | 6,169 | 5,957 | 5,879 |
| 2005 | 6,141 | 5,549 | 6,142 | 5,935 | 6,139 | 5,594 | 5,435 | 5,553 | 5,567 | 6,028 | 5,548 | 5,432 |
| 2006 | 5,851 | 5,158 | 5,955 | 5,679 | 5,814 | 5,791 | 6,018 | 5,817 | 5,711 | 5,900 | 5,816 | 5,545 |
| 2007 | 5,334 | 4,989 | 5,609 | 5,325 | 5,664 | 5,514 | 5,670 | 5,413 | 5,567 | 5,782 | 5,617 | 5,880 |
| 2008 | 5,205 | 4,922 | 5,630 | 5,415 | 5,731 | 4,860 | 5,457 | 5,471 | 5,062 | 5,693 | 5,201 | 5,214 |
| 2009 | 5,166 | 4,974 | 5,589 | 5,339 | 5,651 | 5,558 | 5,460 | 5,598 | 5,297 | 5,732 | 5,478 | 5,127 |
| 2010 | 5,145 | 4,822 | 5,358 | 5,121 | 5,262 | 4,782 | 5,192 | 5,536 | 5,349 | 5,494 | 5,467 | 5,445 |
| 2011 | 4,933 | 3,964 | 5,515 | 5,359 | 5,476 | 5,183 | 5,495 | 5,453 | 5,219 | 5,315 | 5,024 | 5,290 |
| 2012 | 5,274 | 4,866 | 5,237 | 5,169 | 4,838 | 4,643 | 5,184 | 5,204 | 4,739 | 5,230 | 5,007 | 5,005 |
| 2013 | 4,384 | 4,438 | 4,796 | 4,764 | 4,808 | 4,972 | 5,242 | 5,363 | 5,020 | 5,173 | 4,614 | 4,663 |
| 2014 | 4,919 | 4,504 | 5,241 | 5,518 | 5,114 | 5,302 | 5,198 | 5,363 | 5,291 | 4,560 | 4,739 | 4,538 |
| 2015 | 4,718 | 4,592 | 5,048 | 5,143 | 5,115 | 5,197 | 5,298 | 5,834 | 5,425 | 5,265 | 5,203 | 4,663 |
| 2016 | 4,578 | 4,592 | 5,001 | 4,788 | 5,294 | 5,295 | 5,681 | 5,457 | 5,349 | 5,794 | 5,450 | 5,323 |
| 2017 | 5,127 | 5,081 | 5,759 | 5,848 | 5,801 | 5,659 | 5,976 | 5,665 | 5,515 | 6,401 | 5,150 | 5,444 |
| 2018 | 5,925 | 6,195 | 7,196 | 7,440 | 7,314 | 6,795 | 7,308 | 7,861 | 6,762 | 6,866 | 6,953 | 7,209 |
| 2019 | 7,375 | 7,007 | 7,850 | 7,304 | 7,571 | 7,327 | 7,508 | 7,086 | 6,676 | 7,222 | 7,180 | 7,092 |
| 2020 | 7,290 | 7,196 | 9,047 | 7,615 | 7,506 | 8,657 | 9,224 | 9,947 | 9,716 | 10,108 | 9,153 | 8,336 |
| 2021 | 8,534 | 6,645 | 8,416 | 9,443 | 9,048 | 9,007 | 9,671 | 10,068 | 9,929 | 10,367 | 10,860 | 10,044 |
| 2022 | 9,594 | 9,221 | 11,935 | 10,243 | 10,771 | 10,055 | 12,465 | 11,139 | 11,083 | 11,439 | 11,214 | 11,256 |
| 2023 | 13,666 | 12,284 | 13,462 | 13,358 | 12,971 | 12,246 | 12,280 | 12,599 | 12,854 | 12,661 | 12,251 | 12,055 |
| 2024 | 10,861 | |||||||||||
| - = No Data Reported; -- = Not Applicable; NA = Not Available; W = Withheld to avoid disclosure of individual company data. |
| Release Date: 3/29/2024 |
| Next Release Date: 4/30/2024 |