|
Download Data (XLS File) |
|
||||||||
|
||||||||
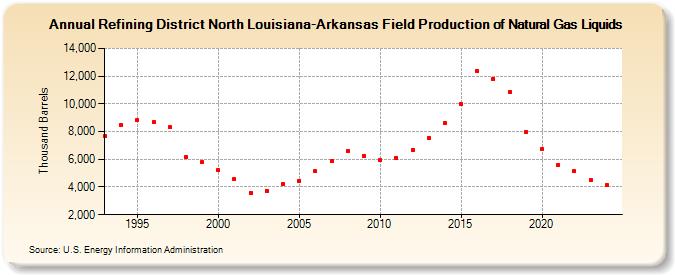
| Refining District North Louisiana-Arkansas Field Production of Natural Gas Liquids (Thousand Barrels) | ||||||||
| Decade | Year-0 | Year-1 | Year-2 | Year-3 | Year-4 | Year-5 | Year-6 | Year-7 | Year-8 | Year-9 |
|---|---|---|---|---|---|---|---|---|---|---|
| 1990's | 7,679 | 8,442 | 8,804 | 8,675 | 8,298 | 6,167 | 5,769 | |||
| 2000's | 5,206 | 4,548 | 3,585 | 3,741 | 4,197 | 4,455 | 5,124 | 5,851 | 6,600 | 6,251 |
| 2010's | 5,951 | 6,127 | 6,654 | 7,546 | 8,642 | 9,994 | 12,401 | 11,817 | 10,865 | 7,994 |
| 2020's | 6,764 | 5,583 | 5,144 | 4,440 |
| - = No Data Reported; -- = Not Applicable; NA = Not Available; W = Withheld to avoid disclosure of individual company data. |
| Release Date: 3/29/2024 |
| Next Release Date: 8/30/2024 |