|
Download Data (XLS File) |
|
||||||||
|
||||||||
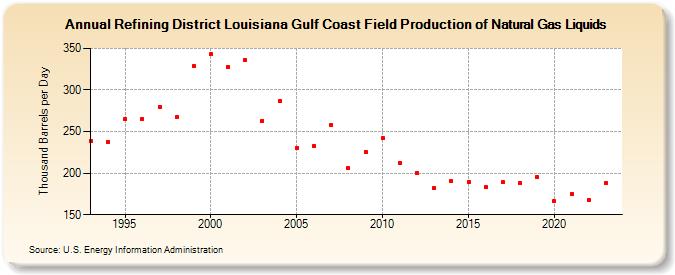
| Refining District Louisiana Gulf Coast Field Production of Natural Gas Liquids (Thousand Barrels per Day) | ||||||||
| Decade | Year-0 | Year-1 | Year-2 | Year-3 | Year-4 | Year-5 | Year-6 | Year-7 | Year-8 | Year-9 |
|---|---|---|---|---|---|---|---|---|---|---|
| 1990's | 239 | 238 | 265 | 265 | 280 | 267 | 329 | |||
| 2000's | 343 | 328 | 336 | 263 | 287 | 230 | 233 | 258 | 206 | 226 |
| 2010's | 242 | 212 | 200 | 182 | 190 | 189 | 183 | 189 | 188 | 195 |
| 2020's | 166 | 175 | 168 | 188 |
| - = No Data Reported; -- = Not Applicable; NA = Not Available; W = Withheld to avoid disclosure of individual company data. |
| Release Date: 3/29/2024 |
| Next Release Date: 8/30/2024 |