|
Download Data (XLS File) |
|
||||||||
|
||||||||
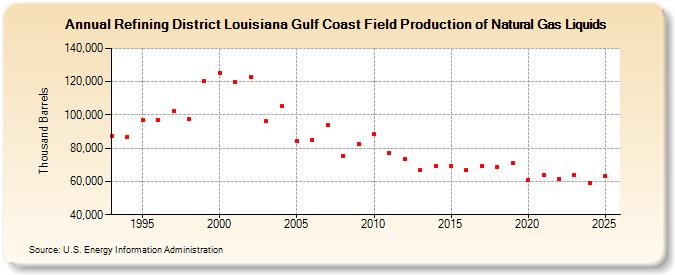
| Refining District Louisiana Gulf Coast Field Production of Natural Gas Liquids (Thousand Barrels) | ||||||||
| Decade | Year-0 | Year-1 | Year-2 | Year-3 | Year-4 | Year-5 | Year-6 | Year-7 | Year-8 | Year-9 |
|---|---|---|---|---|---|---|---|---|---|---|
| 1990's | 87,201 | 86,894 | 96,876 | 96,980 | 102,290 | 97,412 | 120,124 | |||
| 2000's | 125,480 | 119,651 | 122,775 | 96,156 | 105,066 | 84,074 | 85,202 | 94,107 | 75,449 | 82,577 |
| 2010's | 88,453 | 77,235 | 73,218 | 66,598 | 69,377 | 69,117 | 67,031 | 69,019 | 68,464 | 71,093 |
| 2020's | 60,595 | 63,716 | 61,479 | 68,586 |
| - = No Data Reported; -- = Not Applicable; NA = Not Available; W = Withheld to avoid disclosure of individual company data. |
| Release Date: 3/29/2024 |
| Next Release Date: 8/30/2024 |