|
Download Data (XLS File) |
|
||||||||
|
||||||||
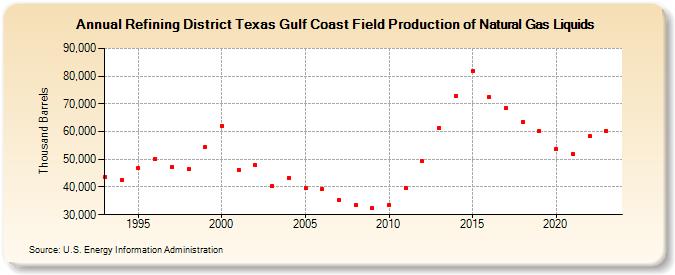
| Refining District Texas Gulf Coast Field Production of Natural Gas Liquids (Thousand Barrels) | ||||||||
| Decade | Year-0 | Year-1 | Year-2 | Year-3 | Year-4 | Year-5 | Year-6 | Year-7 | Year-8 | Year-9 |
|---|---|---|---|---|---|---|---|---|---|---|
| 1990's | 43,631 | 42,559 | 46,809 | 50,021 | 47,294 | 46,557 | 54,488 | |||
| 2000's | 62,165 | 46,264 | 47,884 | 40,201 | 43,350 | 39,720 | 39,354 | 35,407 | 33,349 | 32,350 |
| 2010's | 33,458 | 39,745 | 49,281 | 61,459 | 72,826 | 81,859 | 72,402 | 68,574 | 63,488 | 60,134 |
| 2020's | 53,705 | 51,905 | 58,271 | 60,279 |
| - = No Data Reported; -- = Not Applicable; NA = Not Available; W = Withheld to avoid disclosure of individual company data. |
| Release Date: 8/30/2024 |
| Next Release Date: 8/29/2025 |