|
Download Data (XLS File) |
|
||||||||
|
||||||||
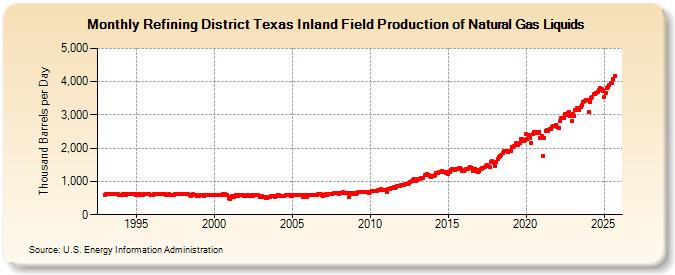
| Refining District Texas Inland Field Production of Natural Gas Liquids (Thousand Barrels per Day) | ||||||||
| Year | Jan | Feb | Mar | Apr | May | Jun | Jul | Aug | Sep | Oct | Nov | Dec |
|---|---|---|---|---|---|---|---|---|---|---|---|---|
| 1993 | 605 | 624 | 623 | 635 | 631 | 626 | 634 | 626 | 626 | 637 | 611 | 579 |
| 1994 | 594 | 598 | 615 | 617 | 606 | 622 | 625 | 628 | 627 | 612 | 618 | 618 |
| 1995 | 598 | 609 | 603 | 611 | 598 | 597 | 608 | 613 | 623 | 620 | 626 | 592 |
| 1996 | 603 | 590 | 614 | 621 | 617 | 611 | 625 | 635 | 627 | 634 | 624 | 605 |
| 1997 | 579 | 608 | 607 | 604 | 598 | 586 | 609 | 617 | 618 | 613 | 613 | 608 |
| 1998 | 626 | 628 | 617 | 632 | 620 | 607 | 575 | 602 | 608 | 598 | 598 | 557 |
| 1999 | 569 | 590 | 587 | 590 | 577 | 602 | 599 | 582 | 602 | 603 | 598 | 593 |
| 2000 | 585 | 596 | 596 | 598 | 578 | 598 | 606 | 615 | 611 | 601 | 593 | 497 |
| 2001 | 458 | 532 | 567 | 540 | 574 | 579 | 567 | 592 | 601 | 606 | 591 | 576 |
| 2002 | 561 | 580 | 579 | 571 | 577 | 578 | 566 | 590 | 593 | 580 | 586 | 540 |
| 2003 | 527 | 550 | 532 | 546 | 494 | 504 | 522 | 542 | 555 | 563 | 575 | 543 |
| 2004 | 571 | 578 | 581 | 575 | 562 | 564 | 576 | 578 | 584 | 588 | 579 | 566 |
| 2005 | 577 | 600 | 600 | 606 | 590 | 580 | 598 | 586 | 519 | 588 | 595 | 546 |
| 2006 | 606 | 598 | 599 | 602 | 597 | 606 | 599 | 597 | 625 | 615 | 612 | 603 |
| 2007 | 574 | 595 | 608 | 602 | 622 | 627 | 637 | 629 | 649 | 661 | 654 | 644 |
| 2008 | 630 | 650 | 652 | 669 | 661 | 645 | 646 | 642 | 533 | 644 | 644 | 622 |
| 2009 | 647 | 637 | 661 | 670 | 685 | 678 | 668 | 671 | 680 | 682 | 689 | 660 |
| 2010 | 695 | 702 | 716 | 715 | 725 | 717 | 732 | 740 | 760 | 754 | 751 | 757 |
| 2011 | 756 | 688 | 787 | 779 | 806 | 800 | 821 | 811 | 823 | 853 | 875 | 867 |
| 2012 | 882 | 889 | 882 | 910 | 924 | 927 | 957 | 974 | 1,020 | 1,044 | 1,070 | 1,021 |
| 2013 | 1,033 | 1,085 | 1,068 | 1,092 | 1,102 | 1,113 | 1,180 | 1,199 | 1,214 | 1,198 | 1,149 | 1,143 |
| 2014 | 1,171 | 1,177 | 1,203 | 1,257 | 1,254 | 1,288 | 1,297 | 1,307 | 1,274 | 1,280 | 1,265 | 1,291 |
| 2015 | 1,212 | 1,290 | 1,330 | 1,382 | 1,344 | 1,355 | 1,364 | 1,388 | 1,401 | 1,393 | 1,375 | 1,316 |
| 2016 | 1,302 | 1,333 | 1,374 | 1,379 | 1,407 | 1,427 | 1,399 | 1,319 | 1,325 | 1,386 | 1,354 | 1,274 |
| 2017 | 1,316 | 1,387 | 1,416 | 1,411 | 1,441 | 1,467 | 1,493 | 1,457 | 1,432 | 1,570 | 1,605 | 1,568 |
| 2018 | 1,466 | 1,573 | 1,661 | 1,726 | 1,765 | 1,789 | 1,851 | 1,901 | 1,907 | 1,904 | 1,881 | 1,906 |
| 2019 | 1,918 | 2,035 | 2,038 | 2,075 | 2,143 | 2,104 | 2,107 | 2,144 | 2,290 | 2,263 | 2,229 | 2,235 |
| 2020 | 2,425 | 2,263 | 2,407 | 2,309 | 2,167 | 2,414 | 2,490 | 2,468 | 2,479 | 2,470 | 2,486 | 2,318 |
| 2021 | 2,368 | 1,756 | 2,315 | 2,530 | 2,556 | 2,521 | 2,578 | 2,581 | 2,624 | 2,656 | 2,674 | 2,707 |
| 2022 | 2,626 | 2,614 | 2,813 | 2,921 | 2,901 | 2,900 | 3,025 | 3,007 | 3,065 | 3,095 | 2,966 | 2,811 |
| 2023 | 2,834 | 2,818 | 3,024 | 3,109 | 3,121 | 3,101 | 3,200 | 3,241 | 3,359 | 3,386 | 3,425 | 3,352 |
| 2024 | 3,090 | |||||||||||
| - = No Data Reported; -- = Not Applicable; NA = Not Available; W = Withheld to avoid disclosure of individual company data. |
| Release Date: 3/29/2024 |
| Next Release Date: 4/30/2024 |