|
Download Data (XLS File) |
|
||||||||
|
||||||||
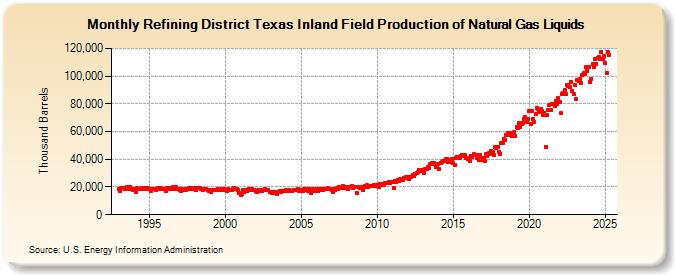
| Refining District Texas Inland Field Production of Natural Gas Liquids (Thousand Barrels) | ||||||||
| Year | Jan | Feb | Mar | Apr | May | Jun | Jul | Aug | Sep | Oct | Nov | Dec |
|---|---|---|---|---|---|---|---|---|---|---|---|---|
| 1993 | 18,756 | 17,469 | 19,325 | 19,048 | 19,571 | 18,772 | 19,648 | 19,412 | 18,787 | 19,752 | 18,328 | 17,946 |
| 1994 | 18,408 | 16,733 | 19,058 | 18,501 | 18,784 | 18,663 | 19,373 | 19,467 | 18,814 | 18,973 | 18,545 | 19,148 |
| 1995 | 18,541 | 17,051 | 18,693 | 18,327 | 18,539 | 17,909 | 18,863 | 18,995 | 18,680 | 19,232 | 18,781 | 18,362 |
| 1996 | 18,683 | 17,106 | 19,019 | 18,637 | 19,135 | 18,337 | 19,390 | 19,672 | 18,801 | 19,658 | 18,722 | 18,748 |
| 1997 | 17,949 | 17,030 | 18,819 | 18,111 | 18,534 | 17,571 | 18,875 | 19,130 | 18,533 | 19,010 | 18,392 | 18,833 |
| 1998 | 19,415 | 17,575 | 19,130 | 18,966 | 19,228 | 18,220 | 17,819 | 18,662 | 18,248 | 18,523 | 17,941 | 17,259 |
| 1999 | 17,654 | 16,518 | 18,187 | 17,705 | 17,899 | 18,051 | 18,573 | 18,034 | 18,062 | 18,687 | 17,944 | 18,384 |
| 2000 | 18,132 | 17,273 | 18,485 | 17,946 | 17,924 | 17,929 | 18,794 | 19,055 | 18,326 | 18,643 | 17,795 | 15,418 |
| 2001 | 14,184 | 14,893 | 17,567 | 16,195 | 17,805 | 17,364 | 17,586 | 18,342 | 18,018 | 18,789 | 17,717 | 17,857 |
| 2002 | 17,386 | 16,242 | 17,947 | 17,142 | 17,876 | 17,328 | 17,531 | 18,285 | 17,779 | 17,986 | 17,580 | 16,726 |
| 2003 | 16,352 | 15,386 | 16,507 | 16,367 | 15,317 | 15,109 | 16,179 | 16,814 | 16,658 | 17,466 | 17,246 | 16,837 |
| 2004 | 17,705 | 16,770 | 18,003 | 17,262 | 17,421 | 16,908 | 17,869 | 17,927 | 17,525 | 18,216 | 17,355 | 17,531 |
| 2005 | 17,881 | 16,813 | 18,607 | 18,189 | 18,296 | 17,388 | 18,543 | 18,161 | 15,568 | 18,240 | 17,858 | 16,921 |
| 2006 | 18,796 | 16,752 | 18,567 | 18,062 | 18,500 | 18,167 | 18,563 | 18,492 | 18,757 | 19,070 | 18,351 | 18,679 |
| 2007 | 17,793 | 16,669 | 18,850 | 18,062 | 19,270 | 18,824 | 19,736 | 19,509 | 19,479 | 20,481 | 19,628 | 19,951 |
| 2008 | 19,530 | 18,863 | 20,216 | 20,067 | 20,487 | 19,351 | 20,012 | 19,911 | 15,986 | 19,952 | 19,330 | 19,289 |
| 2009 | 20,065 | 17,837 | 20,494 | 20,113 | 21,246 | 20,354 | 20,720 | 20,811 | 20,388 | 21,131 | 20,668 | 20,457 |
| 2010 | 21,551 | 19,653 | 22,199 | 21,437 | 22,474 | 21,521 | 22,701 | 22,944 | 22,797 | 23,364 | 22,526 | 23,452 |
| 2011 | 23,425 | 19,274 | 24,382 | 23,384 | 25,000 | 23,989 | 25,451 | 25,138 | 24,700 | 26,445 | 26,255 | 26,870 |
| 2012 | 27,331 | 25,775 | 27,350 | 27,301 | 28,651 | 27,801 | 29,653 | 30,209 | 30,607 | 32,353 | 32,110 | 31,646 |
| 2013 | 32,024 | 30,367 | 33,108 | 32,750 | 34,148 | 33,381 | 36,575 | 37,177 | 36,434 | 37,140 | 34,467 | 35,437 |
| 2014 | 36,301 | 32,945 | 37,283 | 37,724 | 38,882 | 38,646 | 40,193 | 40,521 | 38,212 | 39,672 | 37,947 | 40,012 |
| 2015 | 37,584 | 36,110 | 41,226 | 41,461 | 41,674 | 40,642 | 42,274 | 43,034 | 42,044 | 43,192 | 41,261 | 40,791 |
| 2016 | 40,351 | 38,651 | 42,583 | 41,371 | 43,608 | 42,821 | 43,360 | 40,897 | 39,738 | 42,953 | 40,620 | 39,485 |
| 2017 | 40,783 | 38,833 | 43,896 | 42,316 | 44,682 | 44,002 | 46,270 | 45,177 | 42,948 | 48,659 | 48,140 | 48,605 |
| 2018 | 45,455 | 44,056 | 51,479 | 51,791 | 54,715 | 53,682 | 57,384 | 58,943 | 57,203 | 59,023 | 56,435 | 59,099 |
| 2019 | 59,468 | 56,971 | 63,188 | 62,258 | 66,445 | 63,113 | 65,328 | 66,452 | 68,713 | 70,143 | 66,865 | 69,299 |
| 2020 | 75,181 | 65,636 | 74,631 | 69,272 | 67,184 | 72,409 | 77,198 | 76,497 | 74,384 | 76,562 | 74,570 | 71,856 |
| 2021 | 73,410 | 49,168 | 71,772 | 75,908 | 79,247 | 75,633 | 79,910 | 80,007 | 78,718 | 82,350 | 80,215 | 83,910 |
| 2022 | 81,409 | 73,201 | 87,217 | 87,633 | 89,929 | 86,993 | 93,785 | 93,202 | 91,935 | 95,934 | 88,993 | 87,146 |
| 2023 | 93,464 | 83,394 | 97,526 | 96,644 | 97,986 | 94,680 | 100,748 | 102,214 | 101,663 | 106,367 | 103,701 | 106,461 |
| 2024 | 95,804 | 97,800 | 108,502 | 106,273 | 112,123 | 108,838 | 113,247 | 113,892 | 112,683 | 117,553 | 112,558 | 114,756 |
| 2025 | 109,407 | 102,100 | 117,667 | 115,003 | ||||||||
| - = No Data Reported; -- = Not Applicable; NA = Not Available; W = Withheld to avoid disclosure of individual company data. |
| Release Date: 6/30/2025 |
| Next Release Date: 7/31/2025 |